


Sign up for ZitaPlus, where knowledge and personalized support come together for your success.
Open Real Account Open Demo Account
Markets change, but human behavior rarely does. That’s exactly why patterns like Double Tops and Double Bottoms continue to work, year after year. These classic formations reflect one of the oldest conflicts in trading: the struggle between buyers and sellers at key price levels.
A double top hints that buyers may be running out of steam after a rally, while a double bottom suggests sellers are losing grip after a downtrend. What makes these patterns valuable is the story they tell about momentum, pressure, and the potential for a sharp reversal.
In this guide, we’ll break down how to spot these patterns, how to confirm them, and most importantly, how to trade them with real-world examples.
A Double Top is a classic reversal pattern that signals a potential shift from an uptrend to a downtrend. Visually, it looks like the letter ‘M’. The price tests a resistance level twice but fails to break through, creating two distinct peaks at roughly the same level.
What makes the double top meaningful is the failure of buyers to push the price higher on the second attempt. This hesitation often hints that bullish momentum is weakening and that sellers could be preparing to take over.
The key elements of a strong double top:
Double tops tend to work best after an extended rally, where the market is overbought or showing signs of exhaustion. The breakdown of the neckline is what turns the pattern from a possible setup into a tradable signal.
A Double Bottom is the mirror image of a double top; a bullish reversal pattern that forms after a downtrend. Visually, it resembles the letter ‘W’, where price hits a support level twice, fails to break below it, and starts turning higher.
This pattern signals that sellers tried to push the market lower but failed. The second bounce off support suggests that buying interest is returning, and the selling pressure may be fading.
Key features of a reliable double bottom:
Double bottoms often appear after sharp drops or extended downtrends, giving traders a chance to catch the early stages of a new upward move.

Spotting a double top or bottom goes beyond just seeing an “M” or “W” shape on the chart. To trade these patterns successfully, you need to look for the right context, the right structure, and proper confirmation before pulling the trigger.
Double tops and bottoms work best when they form after a strong directional move. Without a clear trend leading into the pattern, the reversal signal loses meaning.
Both patterns rely on two things:
The pattern isn’t confirmed until price breaks the neckline with strength.
A common confirmation trick is to check for increased volume on the breakout of the neckline. This suggests real participation and higher odds that the move will stick.
Double tops and bottoms can appear on any timeframe, but they tend to be more reliable on higher timeframes (H1, H4, daily) where market noise is reduced.
One of the most common mistakes is trading patterns that are too tight or too flat, especially in low-volatility conditions. Strong patterns are often easy to spot, when you start forcing the shape, it’s often not a valid signal.
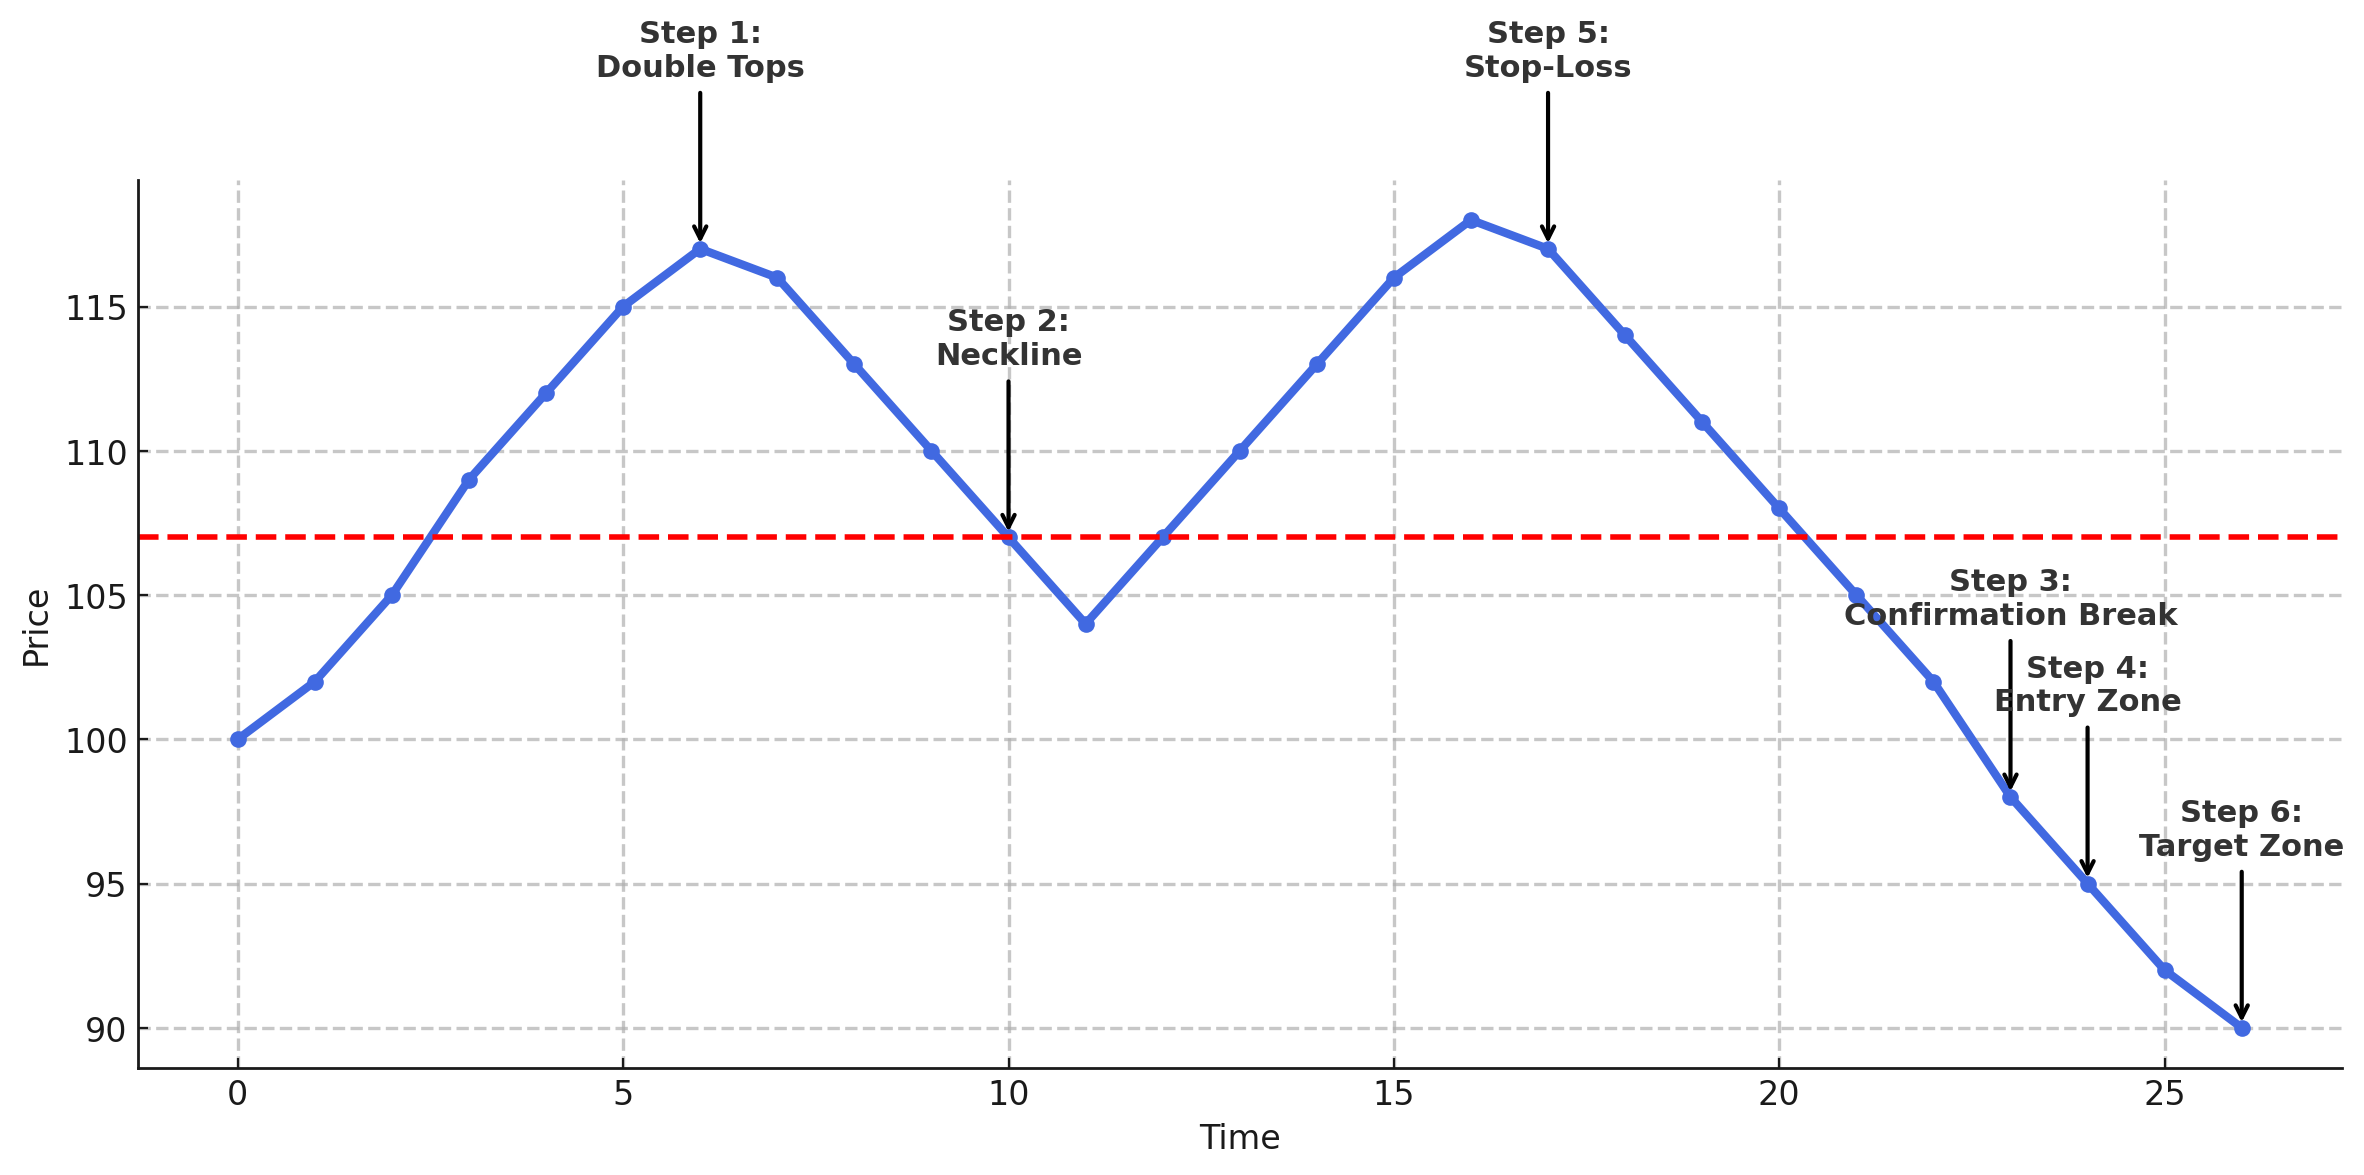
A Double Top signals that buyers have hit a ceiling twice, and the market could be ready to turn lower. But spotting the pattern is only half the story. Here’s how to actually trade it with structure and discipline:
A clean double top often leads to a sharp move, but discipline is key here. Without confirmation, what looks like a reversal could just be a temporary pause.
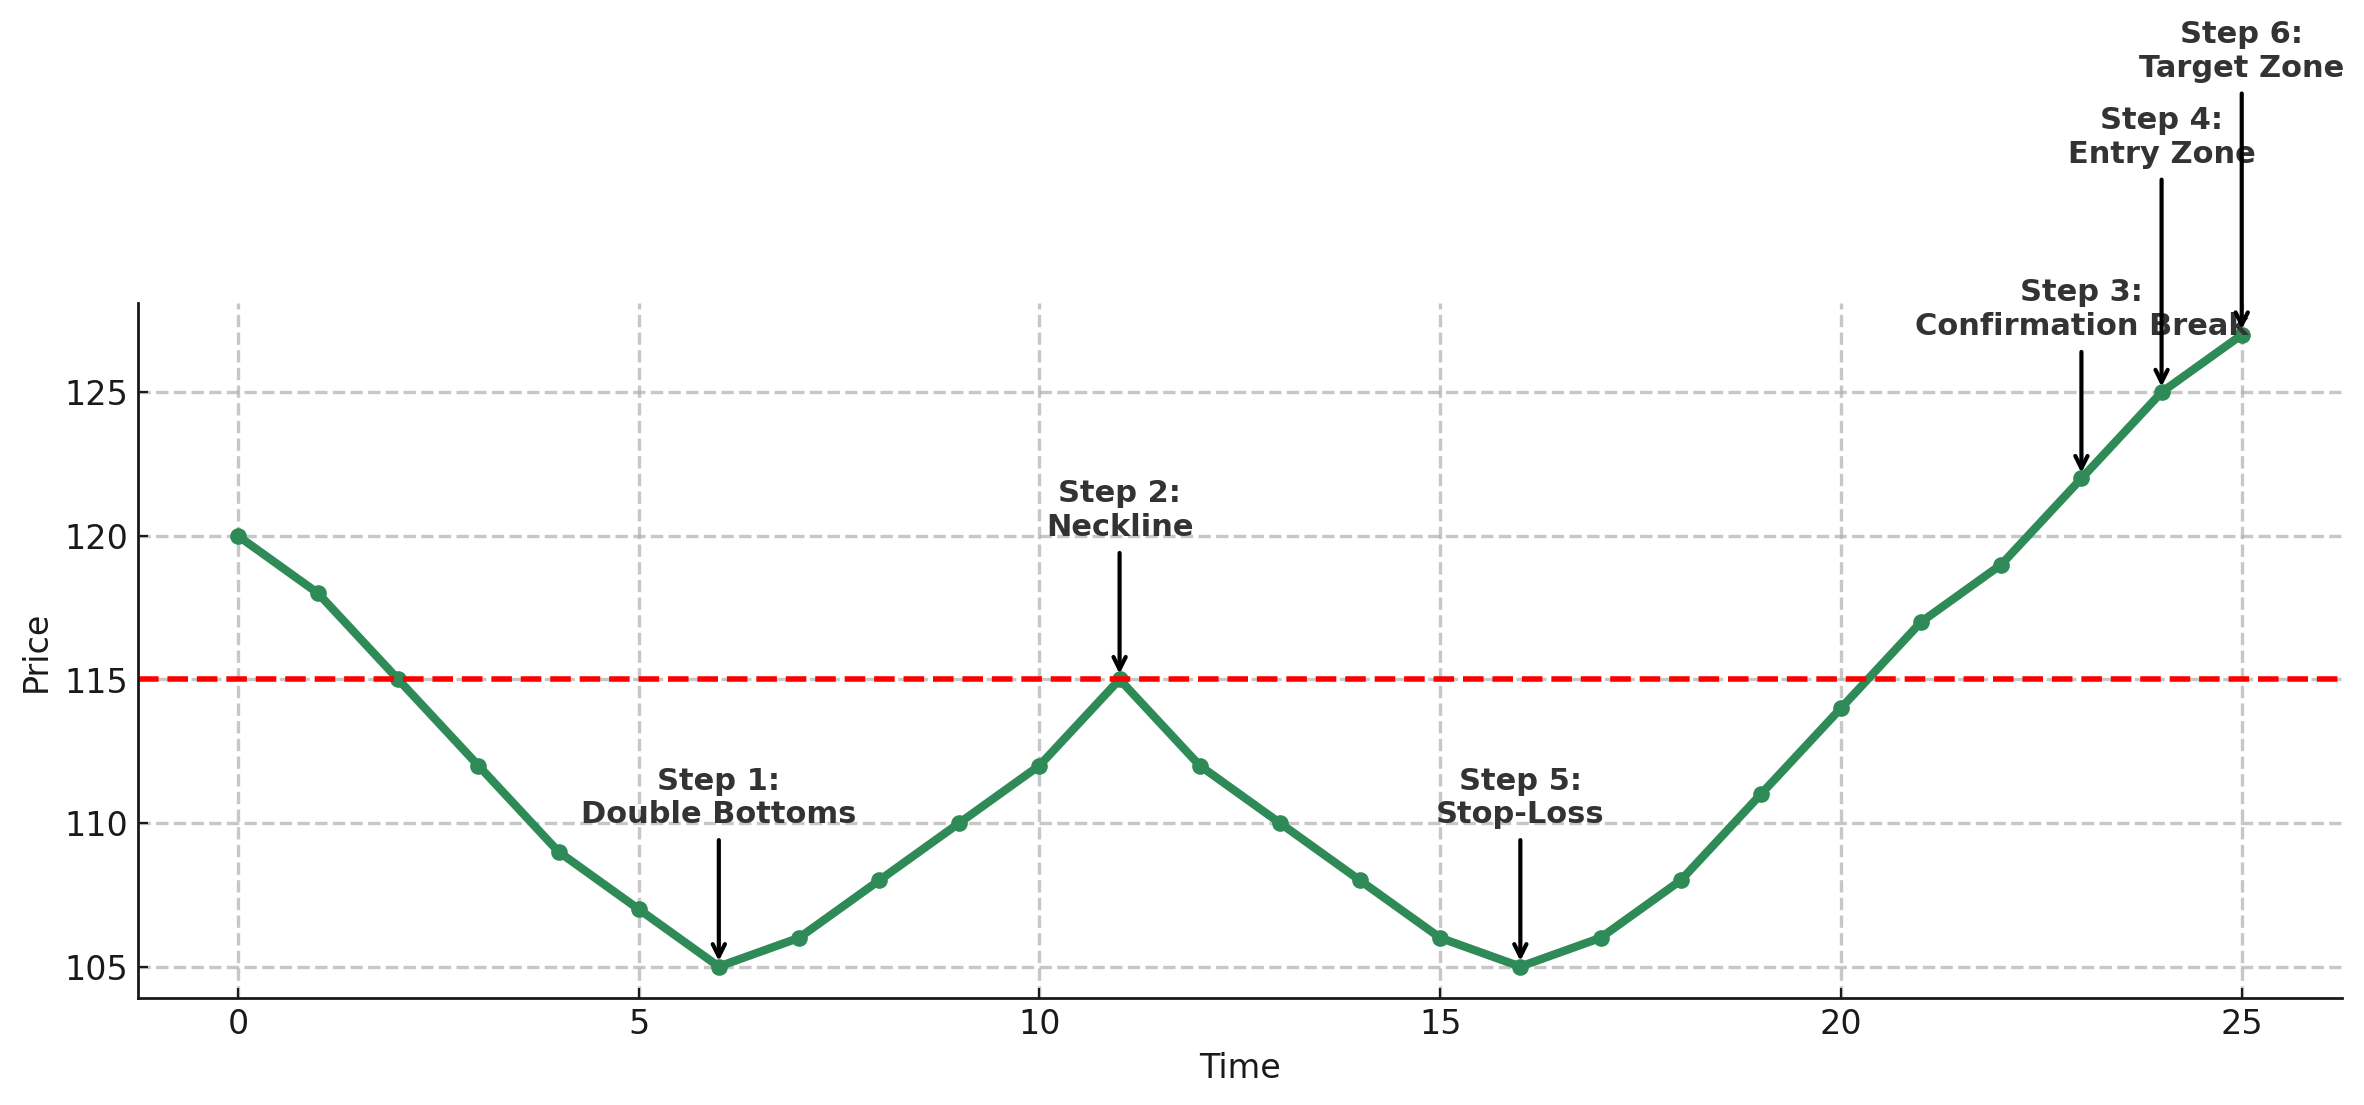
A Double Bottom indicates that sellers may have reached their limit, and buyers are starting to push back. It’s a classic setup for spotting potential reversals from bearish to bullish conditions. Here’s how to trade it step by step:
When combined with context, like oversold conditions or bullish divergence, double bottoms can offer high-quality trade setups with favorable risk/reward.
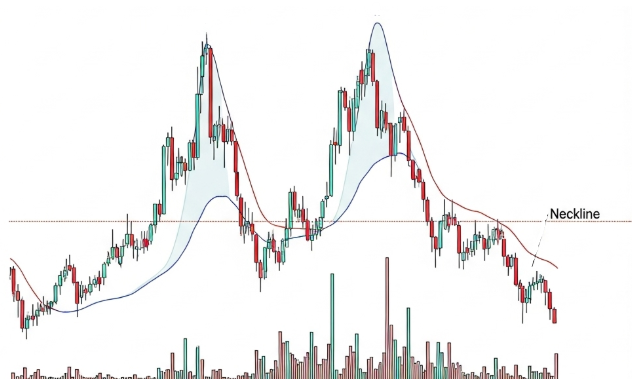
In this chart, you can clearly see how price tests the same resistance level twice, only to fail both times. This is the classic double top pattern in action, showing that buyers are running out of steam.
The real shift happens when price breaks below the neckline; that’s the market tipping its hand. Sellers step in, and momentum flips.
A simple approach here:
What makes this pattern powerful is its simplicity: it captures the moment when the market flips from bullish to bearish, and gives traders a clear structure.
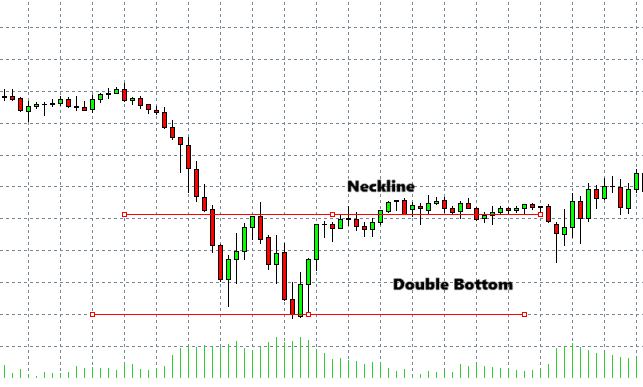
Here, you can see a classic double bottom pattern forming after a steady downtrend. Price tests the same support level twice, but sellers fail to break lower on the second attempt, hinting that the downside is running out of steam.
The real shift comes when the price breaks above the neckline, signaling that buyers are stepping back in and momentum is starting to reverse.
A simple way to trade this setup:
This pattern works because it captures the turning point when sellers lose control, and gives you a clear, structured way to catch potential reversals.
While double tops and bottoms are simple to recognize, many traders fall into the trap of trading them without proper confirmation or context. Here are the most common mistakes to watch out for:
Avoiding these mistakes helps you stay selective and focused on high-probability setups, instead of chasing every possible pattern you see.
Double tops and double bottoms remain some of the clearest price action patterns in trading. Their strength lies in their simplicity; they show you when momentum shifts and give you a structure to act on without overcomplicating things.
Let the pattern complete, look for confirmation, and always consider the bigger picture. When used with discipline, these patterns can become a reliable part of your trading toolkit, helping you spot reversals and manage trades with more confidence.
Would like to learn how to look financial markets from a different angle? Then keep reading and invest yourself with ZitaPlus.


