


Sign up for ZitaPlus, where knowledge and personalized support come together for your success.
Open Real Account Open Demo Account
A price gap happens when an asset opens at a different level from where it previously closed, leaving a blank space on the chart. It’s like the market skipped a beat, and in that silence, something important usually happened. This could be a sudden surge of optimism, a major news release, or an overnight sentiment shift.
Price gaps often signal a strong shift in supply and demand, making them highly relevant to short-term and swing traders. Let’s learn more about them.
Not all price gaps are created equal. Depending on when they appear, gaps can offer different clues about what’s driving market sentiment and how traders might respond.
Here are the main types of price gaps you’ll come across:

These occur when an asset closes at one price and opens the next trading session at a noticeably different level. Common in stocks and indices, EOD gaps often reflect news released after market hours like earnings reports, economic data, or geopolitical events. Since there’s no active trading during the downtime, the market “reprices” at the open.
Weekend gaps show up when markets close on Friday and reopen on Sunday night (or Monday morning, depending on the asset). Forex traders know these well. Political headlines, central bank updates, or global events unfolding over the weekend can cause the price to jump or drop significantly before trading resumes.
While less dramatic, gaps can also happen during the trading day, typically after major announcements or sudden shifts in order flow. These are less predictable but still worth watching.
While end-of-day and weekend gaps are the most common, there are a couple more to keep on your radar:
Each type tells a different story. An EOD gap might point to overnight speculation, while a weekend gap could reflect larger macro forces. Recognizing the timing and context of a gap helps traders decide whether to act quickly, wait for confirmation, or avoid jumping in altogether.
Price gaps might look random on a chart, but they rarely happen without reason. They’re usually a direct response to shifts in sentiment or sudden changes in supply and demand, and understanding the causes behind them can give traders a serious advantage.
Here are the most common causes of price gaps:
These are just a few of the reasons why price gaps happen. The key for traders is not just to notice the gap but to ask why it formed. That’s where the real insight begins.
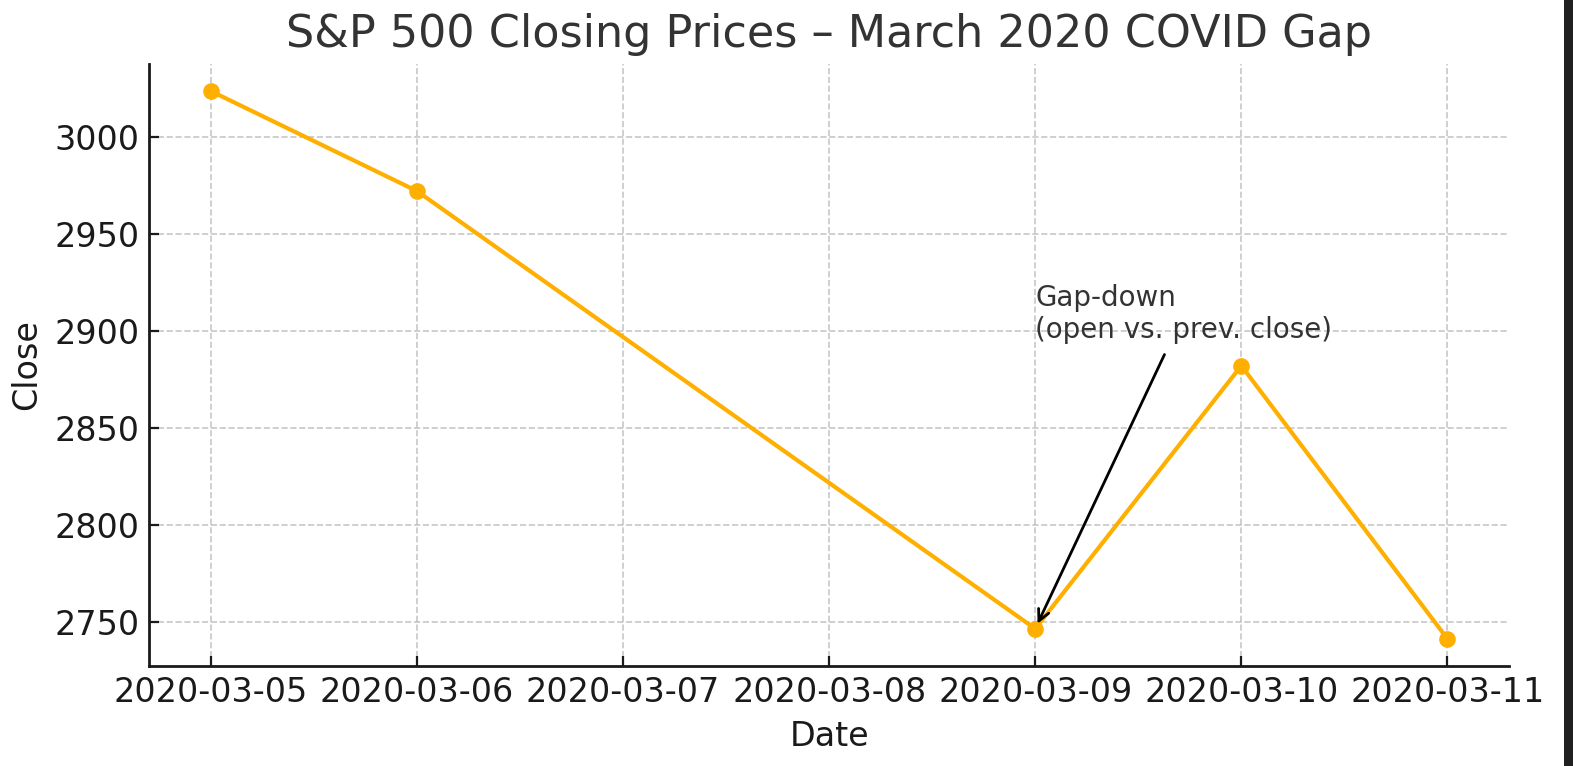
On 9 March 2020 the S&P 500 opened over 100 points below the prior close, an overnight “breakaway” gap driven by escalating COVID-19 fears and an oil-price shock which kicked off a cascade of panic selling.
Because price failed to revisit the gap right away, chart-readers view that unfilled zone (≈2,970) as fresh resistance and confirmation that bearish momentum had taken charge.
Not all gaps are equal; some mark the start of a trend, others signal the end of one. Over time, traders have identified recurring price gap patterns that tend to follow certain behaviors. Knowing how to recognize these can help you decide when to jump in or stay out.
These happen at the beginning of a new trend, often after a long period of consolidation. A breakaway gap usually forms when strong news breaks a stock or currency pair out of a range. Because it reflects a clear shift in sentiment, traders often see it as the start of momentum and look for confirmation to follow the move.
Runaway gaps show up in the middle of a trend, signaling that the market still has energy to push further. They’re often caused by renewed interest, strong volume, or fresh news that supports the existing direction. For trend-following traders, these gap trading chart patterns can offer a solid entry point.
Exhaustion gaps come at the end of a trend when the last push fails to find support and price quickly reverses. This is usually a sign that the market is overextended, and momentum is running out. They often trap late buyers or sellers, making them risky if misread.
True to their name, common gaps aren’t tied to major trends or news; they’re usually short-lived and tend to get “filled” quickly. These gaps often form within a range and lack the volume or force of other types, making them less reliable for long-term setups.
Spotting a gap is easy. Knowing what it means is what separates experienced traders from the rest. Here’s how savvy traders break it down:
Volume Confirmation
Trend Context
Gap Fill Probability
Support and Resistance Zones
Follow-Up Candles
Below are two price gap trading examples that show how different setups can unfold.
Example 1: Breakaway Gap on Earnings
A tech stock closes at $120 and opens the next day at $128 after strong earnings. Volume surges, and the price continues climbing through the morning.
Example 2: Weekend Gap in Forex
EUR/USD closes Friday at 1.1000. Over the weekend, political uncertainty in Europe sparks risk aversion. The pair opens Monday at 1.0950.
Context is everything. The direction, volume, and overall market tone all help determine whether a gap becomes a trading opportunity or a trap.
While trading gaps can be profitable, it also comes with real risks, especially if you’re chasing moves without a plan. Here are the key risks of gap trading to keep in mind:
Many gap trading mistakes happen when emotion takes over: chasing price, skipping confirmation, or ignoring the broader market context. So, should you trade price gaps? If you’re methodical, patient, and understand the risks, they can absolutely be part of your strategy.
Would like to learn how to look financial markets from a different angle? Then keep reading and invest yourself with ZitaPlus.


