


Sign up for ZitaPlus, where knowledge and personalized support come together for your success.
Open Real Account Open Demo Account
One of the biggest reasons traders get stopped out too early or miss realistic profit targets comes down to one thing: not accounting for market volatility. This is where traders turn to Average True Range (ATR) for clarity.
ATR is one of the simplest yet most effective tools for measuring volatility in forex, stocks, and other markets. It doesn’t tell you which direction the market will move, but it tells you how much it’s likely to move, and that can make a major difference in where you place your stop-loss and take-profit levels.
Using this tool in your trading helps you avoid stops that are too tight, targets that are too ambitious, and expectations that don’t match current market conditions. It gives you a volatility-based edge, no guessing, no emotions.
In this guide, we’ll break down what ATR really is, how it’s calculated, and most importantly, how to use it to set smarter stops and more realistic profit targets.
The Average True Range is a technical indicator that measures market volatility, how much the price moves over a given period. It doesn’t predict direction, but it gives you a clear picture of how active or quiet the market is.
This indicator was developed by J. Welles Wilder, the same mind behind the RSI and other popular indicators. Originally created for commodities trading, it’s now used across forex, stocks, and crypto.
The ATR is typically shown as a line beneath your price chart. The higher the line, the more volatile the market. The lower it is, the quieter the price movement tends to be.
So, why does this matter? Because if you know how far a currency pair or asset typically moves, you can set stop-losses and profit targets that make sense for the current environment, not based on guesswork.
The Average True Range (ATR) gives you a sense of how active the market is, not by predicting direction, but by measuring how much price typically moves over a given period. It’s a way to read the market’s “energy,” helping you decide how much room your trade needs to breathe.
When the ATR rises, it signals that price movements are getting larger. This usually happens during news events, breakouts, or strong momentum phases. It’s a clue that the market is heating up.
In this environment, tighter stops might get hit too easily, so you may need more room to let trades develop. At the same time, stronger volatility can support bigger targets, making high ATR conditions attractive for trend or breakout traders looking to capture extended moves.
When ATR drops, it means the market is moving more cautiously, with smaller price fluctuations. This often happens during consolidation, low-volume sessions, or just before major catalysts.
In these conditions, large targets are less likely to hit, and wide stops may not be necessary. Traders may focus on short-term plays or wait for volatility to return before jumping in. A low ATR doesn’t mean there’s no opportunity, it just requires a different approach.
If you're using MetaTrader 5, you can add the ATR indicator with just a few clicks. Here's how:
Insert → Indicators → Oscillators → Average True Range
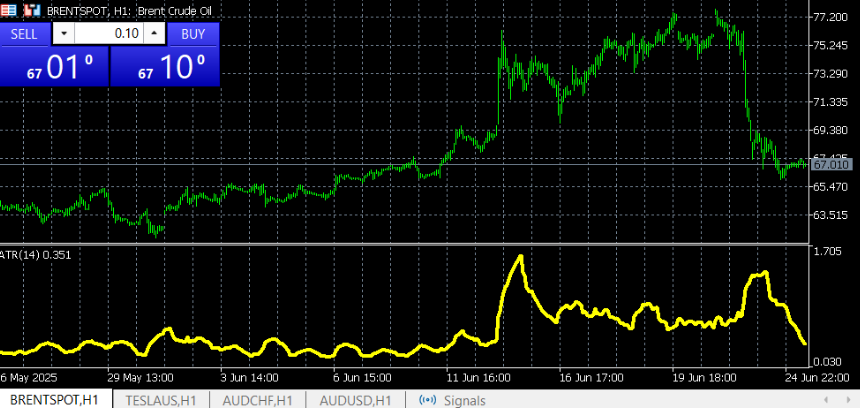
From there, you can customize the settings, including the period, color, and line thickness, to suit your chart preferences. In the example above, ATR(14) is applied to the Brent Crude Oil H1 chart, helping visualize changes in volatility through June.
You don’t need to be a math expert to use this tool effectively, but knowing how it works helps you trust the numbers you see on your chart.
The ATR is calculated by measuring the "true range" of each candle, which takes into account:
Whichever of these three values is the largest becomes the true range for that period. The ATR is then calculated as the average of those true ranges over a set number of candles, usually 14 by default.
In simpler terms, this indicator tells you how much the price has been moving, on average, over the last 14 candles (or whatever setting you choose).
Simple Example:
Let’s say the last few daily candles on EUR/USD moved like this:
The average of those four moves is:
(80 + 95 + 100 + 85) ÷ 4 = 90 pips
So, the ATR is 90 pips. This tells you that EUR/USD is currently moving about 90 pips per day. That number can now help you place your stop-loss and target levels more accurately, based on real market movement.
One of the most common reasons traders get stopped out is that their stop-loss is too tight for current market conditions. That’s where the Average True Range becomes a handy tool; it helps you place stops based on actual price movement, not guesswork.
Instead of setting a fixed number of pips or relying on arbitrary levels, you can use ATR-based stop-losses that adjust with market volatility.
How It Works:
Let’s say you’re trading EUR/USD on the 4-hour chart, and the Average True Range shows 50 pips. This means the price has been moving about 50 pips per candle.
You can now set your stop using a multiple of ATR, depending on your strategy:
So if you’re using 1.5× ATR, you’d place your stop 75 pips away from your entry, giving your trade room to breathe without being overly exposed.
Why It Helps:
The ATR doesn’t guarantee your stop won’t be hit, but it makes it more likely that your stop is placed outside the “noise zone.”

Aside from stop-losses, this tool also helps you decide where to take profit.
Think of it this way: if a currency pair is only moving 50 pips a day, setting a 150-pip target might be too much. On the other hand, if the market is moving a lot, your target can be bigger.
Simple Example:
Let’s say you’re trading USD/JPY on the 1-hour chart.
By using ATR, you set a target that makes sense for how much the market is actually moving, not just what you hope will happen. This helps you avoid targets that are too far or too small, and makes your trading more balanced.
Average True Range works great on its own, but it gets even better when you combine it with other tools. This helps you find smarter entry and exit points based on what the market is actually doing.
Here are a few easy ways to combine ATR with other strategies:
If the price is near a strong resistance level and the ATR is high, you might aim for a shorter target, knowing that the level could stop the price from moving much further.
On the flip side, a high ATR and a break above resistance might suggest there’s room for a bigger move.
Use moving averages to find trend direction, and ATR to set your stop and target.
For example, if the price is above the 50-period MA and ATR is rising, it could be a strong trending move and a good time to give your trade more room.
You can look for a reversal candle (like a pin bar) near support or resistance, then check ATR to decide how far the price might go. If ATR is low, expect a smaller move. If it’s high, your target can be more ambitious.
ATR is a straightforward tool, but using it carelessly can throw off your entire trade. Here are the mistakes traders most often make, and how to avoid them:
What helps most is not a new system, but a better grasp of how to use ATR effectively. With the right application, it becomes a practical guide for managing your trades.
This indicator won’t predict where the price is headed, and it won’t generate entry signals, but that’s not its job. What it does offer is something many traders overlook: a realistic, data-based view of how much the market is actually moving, and that matters.
ATR can help you to stay out of trades that don’t make sense, and manage the ones you do take with more confidence.
As your strategy evolves, it can be the quiet tool in the background, keeping your trade management solid, your expectations reasonable, and your decisions rooted in market reality.
Would like to learn how to look financial markets from a different angle? Then keep reading and invest yourself with ZitaPlus.


