


Sign up for ZitaPlus, where knowledge and personalized support come together for your success.
Open Real Account Open Demo Account
Designed to track momentum and signal potential reversals, it helps traders spot shifts that price alone doesn’t always reveal. Stochastic works best when you know how to adapt it. What works in a calm, ranging market can fail completely in a trending one, and vice versa. That’s why this guide doesn’t just explain how the indicator functions. It walks you through real setups, both in sideways and trending conditions, so you can actually use it as well as understand it.
Let’s break it down.
The Stochastic Oscillator is a momentum indicator that compares a security’s closing price to its recent price range. It doesn’t try to predict future moves but instead shows how strong the current move is, and whether it’s likely to slow down.
At its core, it consists of two lines:
The oscillator moves between 0 and 100, with key levels typically marked at:
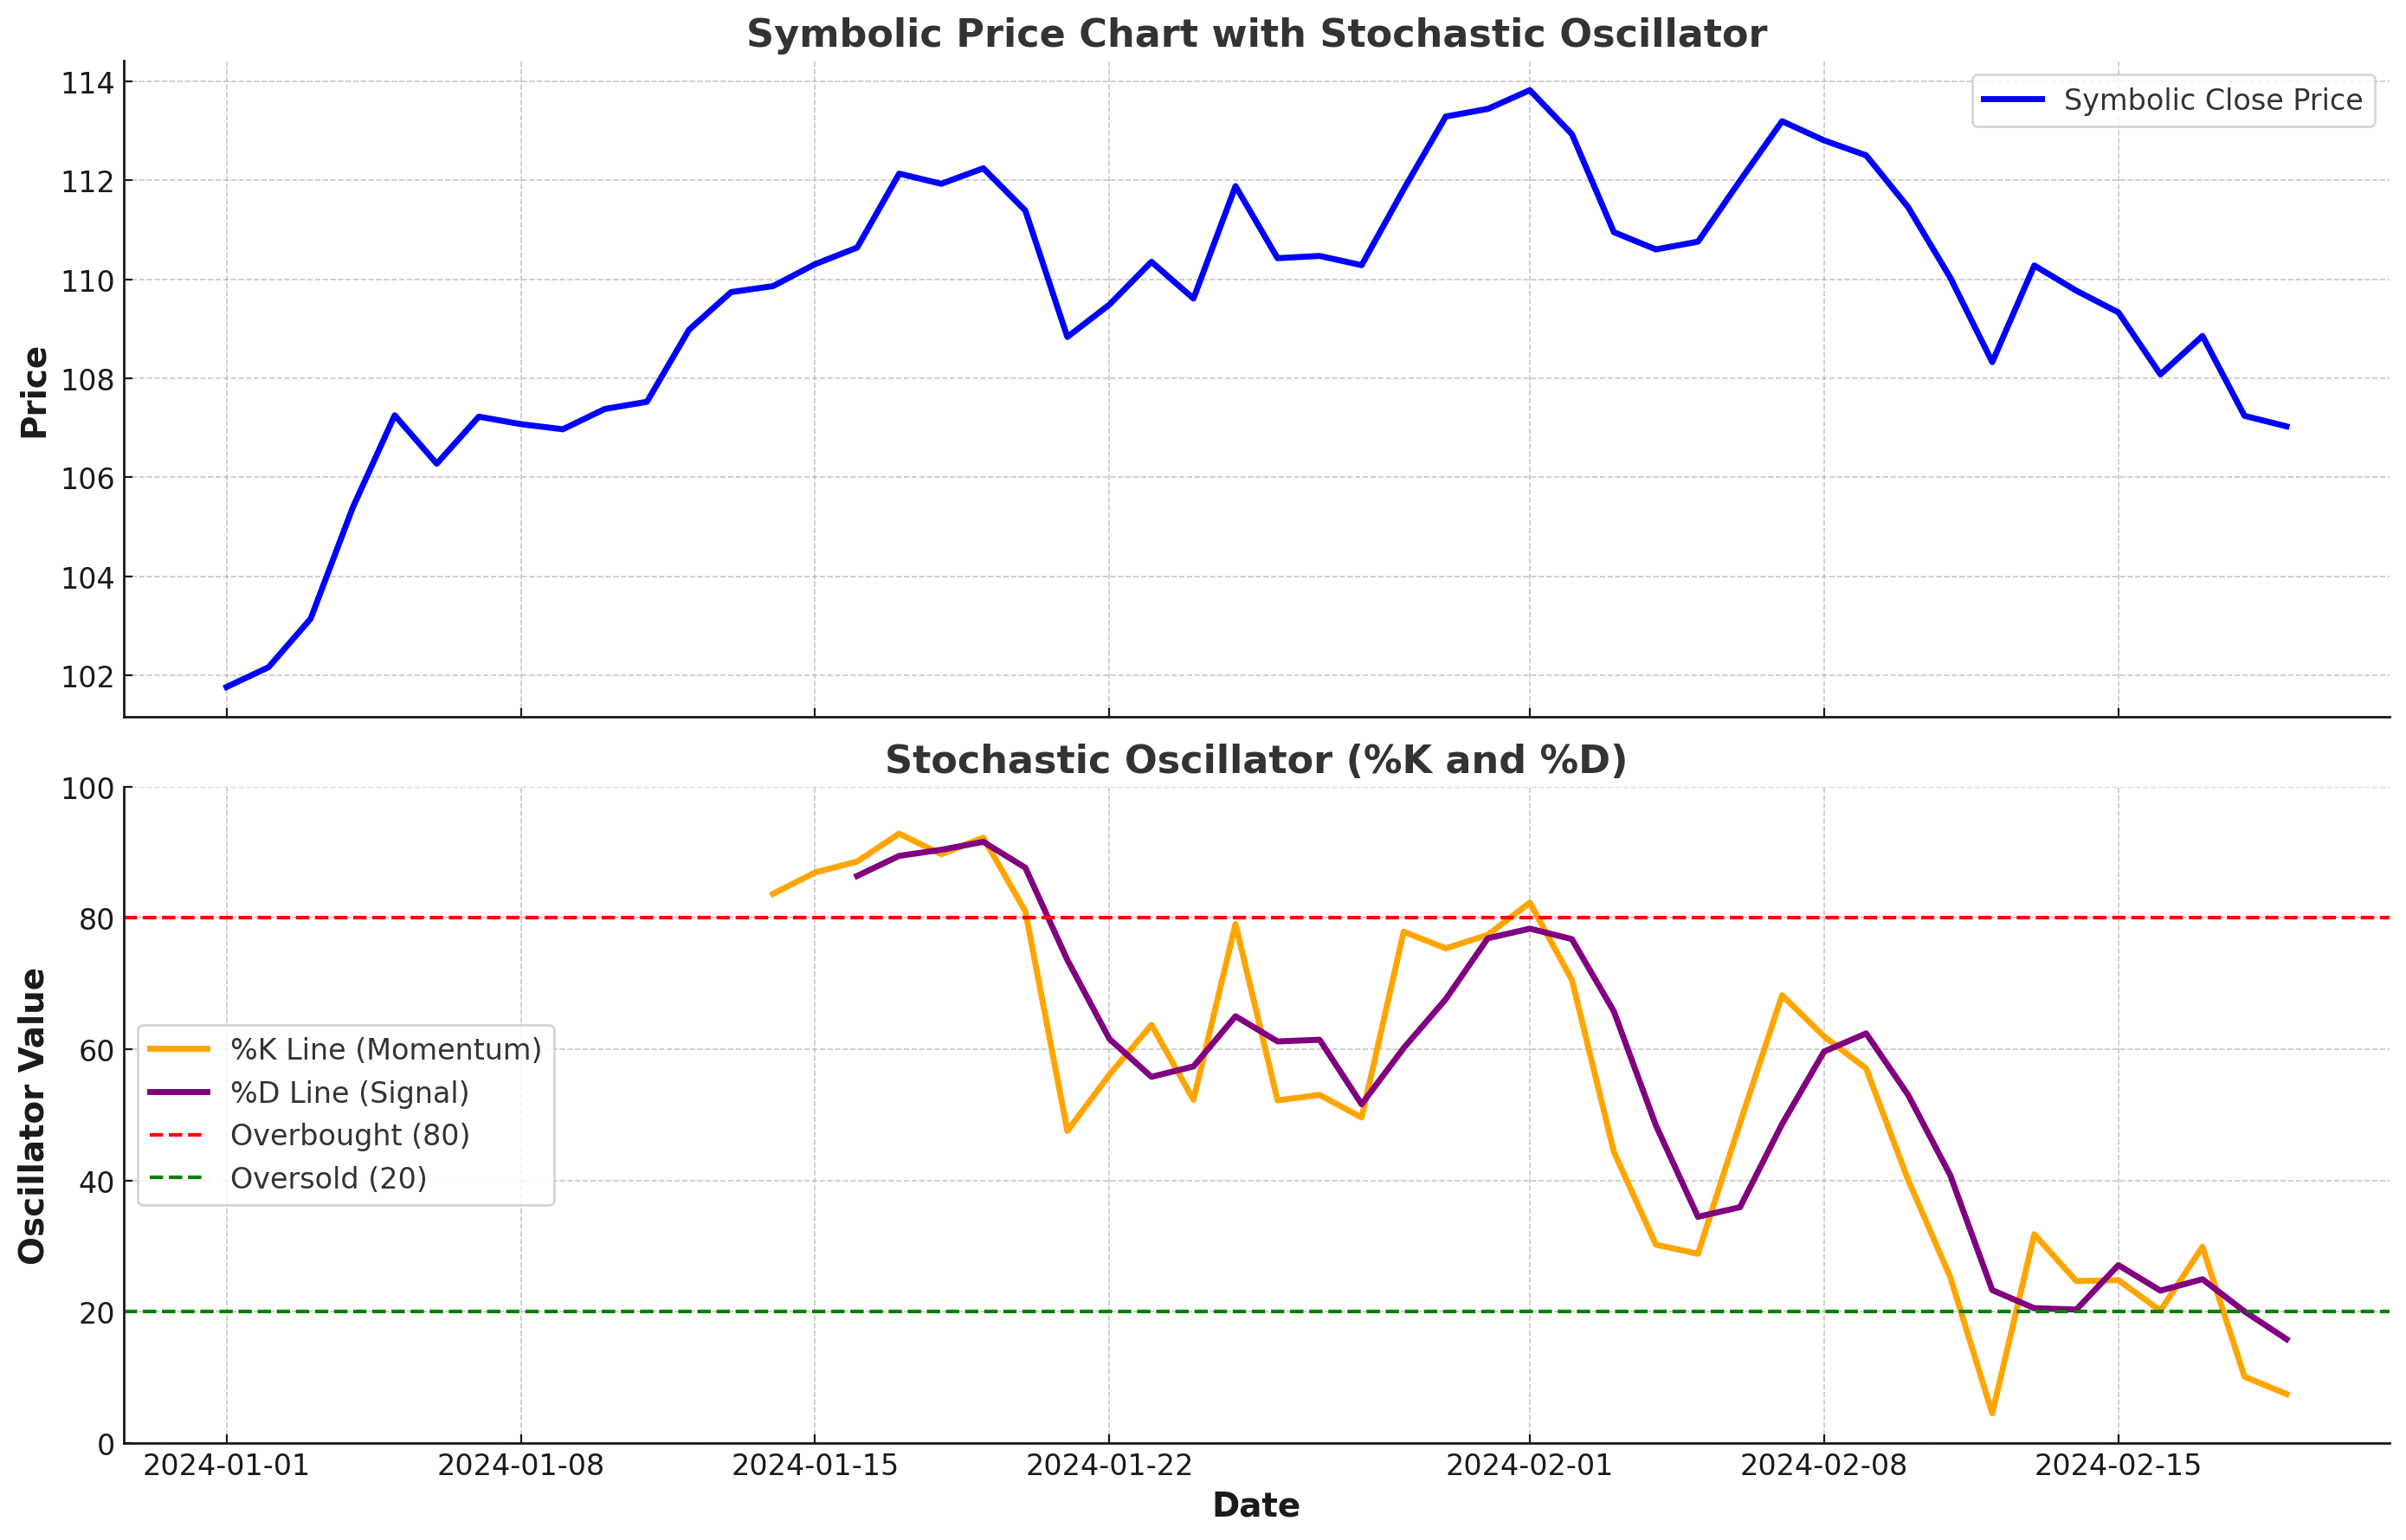
The beauty of Stochastic is in how clearly it shows this momentum shift. Crosses between the %K and %D lines, especially in the overbought or oversold zones, often act as early warning signals, but context matters. In ranging markets, they can offer precise entries. In trending markets, they help spot pullbacks rather than full reversals.
At first glance, the Stochastic Oscillator might just look like two wavy lines moving up and down. But once you know what to watch for, it becomes a highly effective way to time entries and exits.
When the faster %K line crosses above the slower %D line, it can suggest that bullish momentum is picking up. A cross below? Bearish pressure might be taking over.
These crossovers are especially important when they occur in extreme zones, near 20 or 80, but should always be viewed in the context of the broader market.
These levels don’t mean the market will instantly reverse; they mean price has stretched far enough from its recent range that a pullback or slowdown is likely.
When price makes a higher high but Stochastic makes a lower high, it’s called bearish divergence, a sign that momentum is weakening.
If price makes a lower low but Stochastic makes a higher low, that’s bullish divergence; momentum might be shifting upward.
Divergences don’t form often, but when they do, they can precede important turning points. The takeaway? Don’t trade Stochastic signals on their own. Always pair them with market structure, trend direction, or support/resistance levels. That’s how you turn a signal into a setup.
The Stochastic Oscillator really shines in sideways or range-bound markets, where price moves between clear support and resistance levels. In these conditions, it can help you catch short-term reversals with surprisingly accurate timing.
When the price is bouncing between two horizontal zones, the Stochastic helps you spot when momentum is fading near the edges of that range.
Here’s how a typical ranging setup works:
It works the same in reverse:
This type of setup is ideal for traders who prefer quick, mean-reverting trades rather than riding trends. But remember, it only works when the market is genuinely ranging. If a breakout is brewing, these signals will lose their advantage.
While many traders associate the Stochastic Oscillator with range-bound setups, it can also be a useful tool in trending markets if you adjust how you use it.
In strong trends, traditional overbought/oversold signals can be misleading. An asset can stay "overbought" or "oversold" for extended periods without reversing. That’s why the goal here isn’t to catch reversals, it’s to time pullbacks in the direction of the trend.
The Stochastic Oscillator is flexible, you can use it for scalping, day trading, or swing setups. But choosing the right timeframe and settings makes all the difference in how well it works with your existing strategy.
The classic setting is (14, 3, 3):
But depending on the market and timeframe, you might adjust:
Testing and adjusting is the best approach. If your signals feel too jumpy, lengthen the periods. If you’re getting signals too late, try shortening them. Stick to one market, experiment with different settings, and track how the signals perform in both trending and ranging conditions.
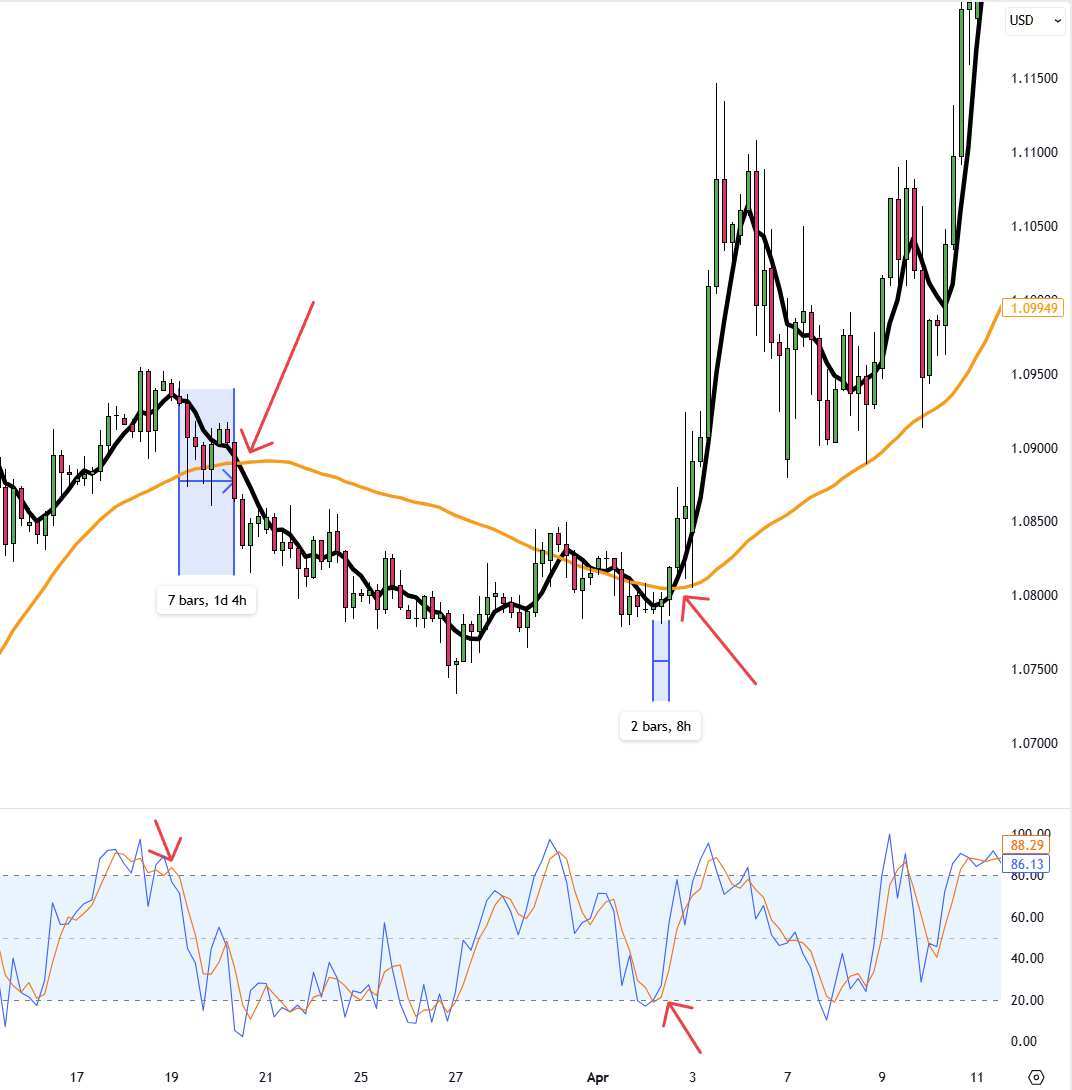
This chart shows how combining a 100-period moving average with the stochastic oscillator can help confirm trend-based setups. On the left, price drops below the moving average as the stochastic crosses down from overbought levels, signaling a potential short. Later, a bullish shift forms as price moves above the moving average and the stochastic crosses up from oversold territory, aligning for a long entry. This dual confirmation helps filter trades in the direction of the broader trend.
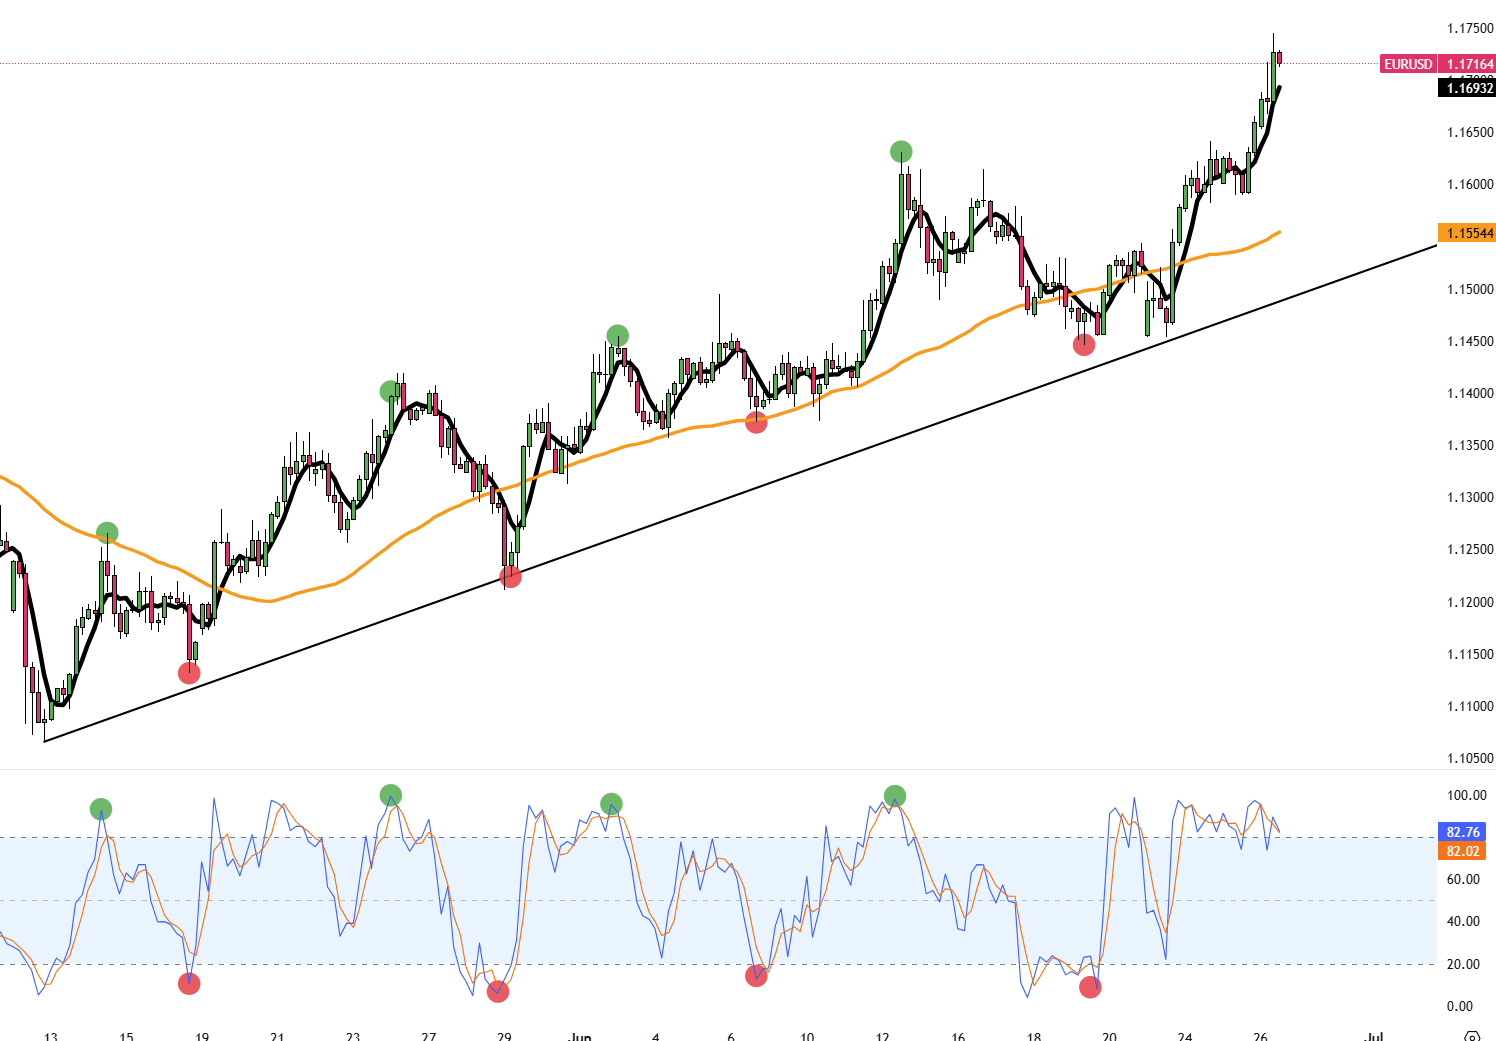
In this EUR/USD chart, we combine a rising trendline with stochastic signals to catch high-probability entries. Each time the price bounces off the trendline (marked in red), the stochastic also crosses up from oversold levels, providing strong confirmation to go long.
This dual validation, support holding at the trendline, and momentum shifting via the oscillator, creates a powerful setup. Even when pullbacks occur, as long as the trendline remains intact and the stochastic confirms, buyers remain in control. It's a clean and confident way to ride the trend, not fight it.
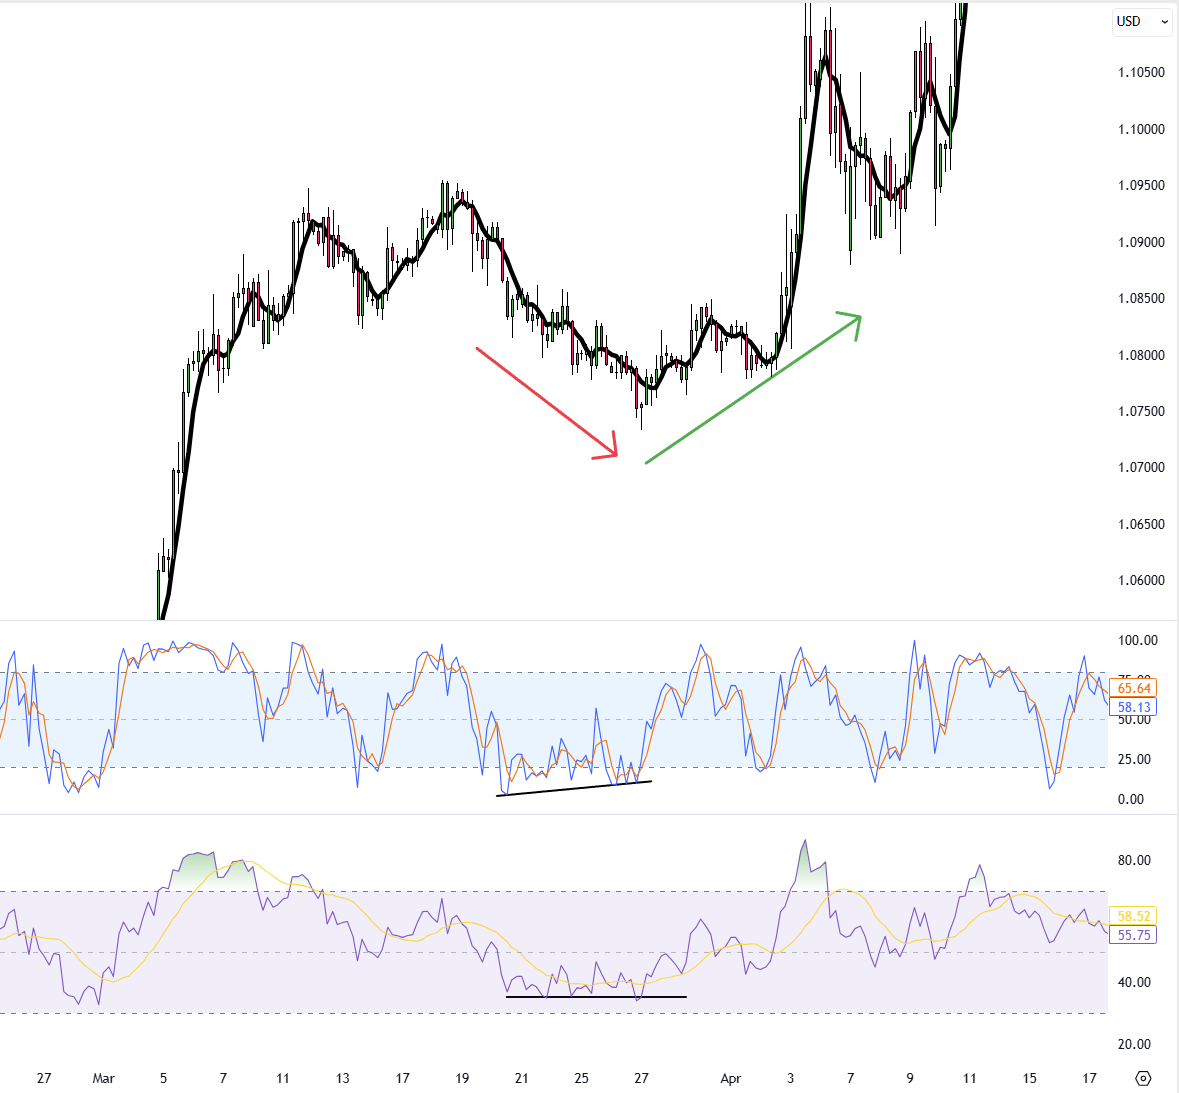
A bullish divergence forms as both the stochastic oscillator and RSI print higher lows while price continues to slide. This early signal suggests sellers are losing strength, even before the price shows signs of recovery.
Once the stochastic crosses upward and RSI begins rising above its midline, momentum shifts clearly in favor of buyers. Using these two indicators together provides a more reliable read on potential reversals than relying on either one alone.
The Stochastic Oscillator is popular because it’s simple, but that simplicity can lead to mistakes when traders use it without context. Here are some of the most common errors and how to avoid them:
Just because Stochastic is above 80 or below 20 doesn’t mean a reversal is coming. In trending markets, it can stay in those zones for long periods.
What to do instead: Treat these levels as warning signs, not entry signals. Combine them with trend direction or key price zones before making a decision.
A bullish crossover in a strong downtrend isn’t enough. Without understanding where price is in the bigger picture, signals can be misleading.
What to do instead: Use Stochastic to improve entries, not to define direction. Always trade in line with the broader trend or range.
Not every %K and %D crossover deserves a trade. Jumping in at every cross leads to overtrading and unnecessary losses.
What to do instead: Add filters. Only take signals that align with structure, support/resistance, or confluence from other tools.
Different assets behave differently. Using the same Stochastic settings across all markets and timeframes won’t give consistent results.
What to do instead: Test and adjust your settings. Shorter periods for fast markets, longer periods for smoother signals.
When you use it with purpose, the Stochastic Oscillator becomes a reliable way to read momentum shifts and improve your entries. It rewards patience, timing, and the ability to adapt depending on the market you’re in.
This indicator is about making signals work for your approach, not the other way around, to offer a clearer view of when to act and when to wait.
Would like to learn how to look financial markets from a different angle? Then keep reading and invest yourself with ZitaPlus.


