Start Trading Now
Sign up for ZitaPlus, where knowledge and personalized support come together for your success.
Open Real Account Open Demo Account
Managing downside exposure in the foreign exchange market requires more than just eyeballing daily chart patterns or relying on basic stop-loss orders. The currency market operates 24 hours a day with heavy leverage, tight spreads, and sudden liquidity drops. During quiet market sessions, standard risk calculations keep your portfolio steady. But when an unexpected event hits, relying on the wrong metric can leave your trading capital completely exposed.
For decades, Value at Risk served as the primary statistical tool for institutional currency desks and fund managers trying to measure potential losses. However, structural blind spots in how it calculates extreme events led to the adoption of Expected Shortfall. Understanding how these two frameworks differ is essential for anyone trading leveraged currency pairs in modern financial markets.
The forex market is unique in its liquidity and structure. Unlike equity markets that open and close at set daily times, forex operates in a continuous global loop. However, this liquidity is not uniform. The brief gap between the New York close and the Asian open regularly sees order books thin out, creating prime conditions for sudden price jumps.
Quiet FX Session ──► Liquidity Drops ──► News Shock ──► Price Gap Bypasses Risk Model
When you add leverage to this continuous environment, minor price movements turn into significant equity swings. Calculating your potential downside before taking on large currency positions is the only way to avoid catastrophic margin calls. Both Value at Risk and Expected Shortfall attempt to answer how much money you stand to lose, but they ask the question in fundamentally different ways.
Value at Risk, commonly known as VaR, provides a single monetary or percentage figure that estimates the maximum loss an account should expect over a given timeframe at a specific confidence level.
For instance, if an FX desk reports a 1-day 99% VaR of $50,000, it means that under normal market conditions, there is a 99% probability that daily trading losses will not exceed $50,000. However, it implies that on 1% of trading days, losses will cross that $50,000 line.
Under basic parametric assumptions, where currency returns are modeled on a standard normal distribution curve, VaR is calculated using the following formula:

In this formula, Z alpha represents the critical value for your chosen confidence level alpha (such as 2.326 for a 99% confidence level), sigma is the volatility of the currency pair, and Delta t is the holding period time horizon.
The fundamental problem with VaR in forex trading is that it acts purely as a cutoff line. It tells you where the bad days start, but it remains completely silent about how severe those bad days will get once the line is crossed.
If a flash crash or central bank policy surprise occurs, your actual loss might be $51,000, or it might be $500,000. Standard VaR treats both outcomes identically because both simply sit inside that 1% tail. In a market where high leverage leaves no room for error, this blind spot creates a dangerous illusion of safety.
Expected Shortfall, also known as Conditional VaR or CVaR, addresses the exact flaw that makes VaR risky for currency traders. Rather than stopping at the cutoff line, Expected Shortfall measures the mathematical average of all losses that fall beyond the VaR threshold.
In plain language, while VaR asks what the minimum loss will be on a bad day, Expected Shortfall asks how bad the average loss will be when a true disaster strikes.
VaR Cutoff Line ──► Calculate All Tail Losses ──► Take Average = Expected Shortfall
Assuming a continuous loss distribution f(x) for an FX portfolio, Expected Shortfall at a confidence level alpha is defined as:
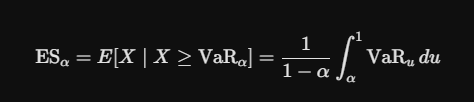
This calculation integrates over every single loss outcome between the confidence threshold alpha and 100%. If your confidence level is set at 97.5%, Expected Shortfall calculates the average loss across every scenario sitting inside that worst 2.5% tail of possibilities.
The structural differences between these two risk metrics directly impact how forex portfolios are managed, especially during periods of geopolitical tension or central bank shifts.
| Feature | Value at Risk (VaR) | Expected Shortfall (ES) |
| Core Question | What is the maximum loss expected 99% of the time? | What is the average loss when the 1% worst case happens? |
| Tail Severity | Ignores how deep the loss goes past the cutoff | Directly averages all outcomes inside the extreme tail |
| Mathematical Property | Fails subadditivity under non-normal conditions | Guaranteed to be coherent and subadditive |
| Regulatory Standard | Former Basel II benchmark | Current Basel III benchmark (at 97.5% confidence) |
| Handling of Fat Tails | Underestimates risk during sudden currency spikes | Captures severe market gaps and tail shocks |
In formal risk theory, a sound risk metric must satisfy a principle called subadditivity. This principle states that combining two separate currency positions should never create more total risk than the sum of their individual risks combined:

When currency distributions experience extreme volatility, standard VaR can fail this test. It can show that holding a combined position in EUR/USD and GBP/USD is riskier than holding them separately, completely ignoring the mathematical benefits of diversification. Expected Shortfall is proven to be subadditive in all situations, making it a far more reliable metric for multi-currency portfolios.
Comparing these two tools during historical currency crises illustrates why institutional desks made the switch.
Consider a currency pair like USD/JPY, where a central bank might enter the spot market unannounced to support its home currency. Prior to the intervention, implied volatility metrics might look calm, yielding a low daily VaR figure.
When the central bank dumps foreign reserves into the market, exchange rates can shift hundreds of pips in seconds. An account operating strictly on VaR will see its risk threshold breached instantly, with no indication of how deep the drawdown will go.
An Expected Shortfall model factors in those historical tail spikes, reflecting a higher risk requirement ahead of time that accounts for potential intervention gaps.
Quiet USD/JPY Market ──► Low VaR Baseline ──► Central Bank Intervention ──► Massive Execution Gap
The most severe demonstration of tail risk in modern FX trading occurred when the Swiss National Bank unexpectedly abandoned the 1.20 floor on EUR/CHF. Liquidity disappeared instantly, order books emptied, and price quotes jumped wildly across global platforms.
Traders using VaR models had set stop-loss orders based on standard volatility metrics. When the market reopened hundreds of pips lower, those stops were filled with massive slippage.
Because VaR only measured the risk up to the 99% line, it completely failed to prepare brokers and funds for the depth of the price gap. An Expected Shortfall framework, by evaluating the entire tail, forces risk managers to hold larger liquid capital buffers specifically designed to survive that scale of structural price move.
To see how these concepts function in practice, imagine an active trading desk managing a $1,000,000 position in a volatile cross pair like GBP/JPY.
Using historical price data from 1,000 trading sessions, the risk team sorts daily P/L outcomes from the worst loss to the best gain.
In this scenario, reporting only the VaR figure tells the manager that losses should stay under $20,000 most of the time. Reporting the Expected Shortfall alerts the manager that when things go wrong, the actual hit to equity averages $32,000. That difference changes how much leverage the desk can safely run.
You do not need a team of quantitative analysts to apply these institutional risk concepts to your own currency trading.
First, recognize that setting a standard stop-loss order does not guarantee your maximum loss during high-impact news events or weekend gaps. Price gapping can bypass your stop price entirely, filling your order at the next available market price.
Second, avoid sizing your positions based purely on standard daily price ranges. Currencies spend long stretches in quiet consolidation before breaking out into high-volatility moves. Incorporating an Expected Shortfall mindset means keeping real position leverage low enough that an unexpected 2% or 3% price gap will not cause irreversible damage to your account balance.
Why did global banking regulators replace VaR with Expected Shortfall?
Regulators under the Basel III framework made the switch because VaR failed to capture the true depth of losses during the 2008 financial crisis. Expected Shortfall provides a realistic picture of tail risk and properly accounts for portfolio diversification benefits.
Can Expected Shortfall be calculated using a simple normal distribution?
Yes, parametric formulas exist for Expected Shortfall under a normal curve. However, because currency returns display fat tails, using historical simulation or Monte Carlo models usually produces far more accurate results.
Is Expected Shortfall always larger than Value at Risk?
Yes, for any given portfolio and confidence level, Expected Shortfall is mathematically guaranteed to be equal to or greater than VaR because it takes the average of all loss outcomes extending beyond the VaR threshold.
What confidence level is standard for Expected Shortfall in FX trading?
Under current international banking standards, a 97.5% confidence level for Expected Shortfall is commonly used, which offers a comparable risk coverage to a traditional 99% VaR calculation while providing better tail stability.
Does using Expected Shortfall prevent slippage during a flash crash?
No risk metric can alter live market execution or prevent slippage when order book liquidity vanishes. Expected Shortfall simply gives you a realistic estimate of potential tail losses ahead of time, helping you adjust your account leverage before a crash occurs.
Would like to learn how to look financial markets from a different angle? Then keep reading and invest yourself with ZitaPlus.