


Sign up for ZitaPlus, where knowledge and personalized support come together for your success.
Open Real Account Open Demo Account
When we talk about investment performance, the conversation usually starts and ends with total return. A portfolio gained 15%, a stock climbed 30%, or a fund beat the index by a few percentage points. While those headline numbers grab attention, they tell less than half the story.
Professional investors look past raw gains. They want to know exactly how much structural risk was required to hit those numbers. An asset that banks a 20% gain by swinging wildly up and down isn't automatically better than one that secures a steady 15% return with minimal drama. In the institutional world, generating consistent returns while keeping a tight lid on risk is the ultimate sign of a superior investment strategy.
This is exactly why risk-adjusted returns matter. They level the playing field, allowing you to compare completely different market opportunities on an apples-to-apples basis by weighing reward against risk. Instead of looking only at how much money an asset made, they answer a far more important question: did the performance actually justify the stress and uncertainty?
Whether you are building a diversified retirement portfolio, active in the forex markets, picking individual stocks, or auditing a professional fund manager, adopting this mindset will completely change how you allocate capital.
Imagine evaluating two separate portfolios over a twelve-month cycle.
At first glance, raw logic makes Portfolio A look like the winner because the terminal number is higher.
Yet, experienced asset managers will pick Portfolio B almost every single time. Lower volatility means an investment is fundamentally easier to hold onto during a market rout, saving you from making a panic-induced exit at the absolute bottom. From a pure math perspective, avoiding deep drawdowns creates a much smoother, more efficient long-term compounding runway. Focusing solely on absolute gains blinds you to these operational realities.
Every investment requires you to risk capital. While no single formula can map out every real-world curveball, understanding the core hazards clarifies why risk-adjusted metrics are so vital.
This is the baseline vulnerability to macro movements that lift or sink the entire financial system. Major economic slowdowns, sudden central bank interest rate pivots, or unexpected geopolitical conflicts will shake broad market performance, regardless of how fundamentally sound your individual assets are.
Volatility measures the speed and intensity of price swings. High volatility can print massive paper profits during a bull run, but it can just as easily trigger rapid, devastating liquidations when a market trend snaps.
Fixed-income investors must constantly weigh the probability that a corporate or sovereign issuer will default on its payment obligations. This explains why lower-rated corporate debt has to offer much higher yields than bulletproof government bonds to attract capital.
Some assets can be converted to cash in milliseconds. Others require months of searching just to find a serious buyer. When markets lock up during a financial panic, a lack of deep liquidity can quickly turn a paper loss into an absolute catastrophe.
Allocating capital to international assets exposes your portfolio to forex fluctuations. Even if an overseas equity position performs brilliantly in local terms, an unfavorable shift in exchange rates can completely wipe out your net gains once that capital is converted back into your home currency.
One of the immutable laws of economics is that chasing higher projected returns requires you to accept higher baseline uncertainties.
[ Lower Certainty / Speculative Assets ] ──► Expects High Risk Compensation [ Higher Certainty / Defensive Assets ] ──► Accepts Low Risk Compensation
This doesn't mean taking wild risks guarantees a massive payout; it simply means the market demands a premium to hold uncertain assets. Government bonds offer modest returns because their default risk is virtually zero. However, speculative assets present eye-watering targets because their future survivability is completely up in the air. Wealth management is about optimizing this balance, not blindly hunting the biggest number on the board.
Of all the tools used to audit investment efficiency, the Sharpe Ratio is the undisputed industry standard.
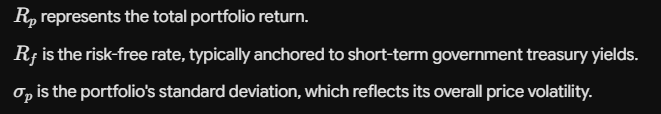
The Sharpe Ratio calculates exactly how much excess return you are squeezing out of an investment for every unit of total volatility you endure.
The standard equation is expressed as:

The components are straightforward to track:
The calculation is simple: the higher the resulting Sharpe Ratio, the more efficient the underlying investment strategy is.
While asset classes vary wildly based on prevailing macro regimes, institutional allocators generally use this baseline scale:
| Sharpe Ratio | Institutional Interpretation |
| Below 1.0 | Inefficient risk-return profile |
| 1.0 to 2.0 | Strong, well-managed performance |
| 2.0 to 3.0 | Highly efficient strategy execution |
| Above 3.0 | Exceptional, rare long-term stability |
While the Sharpe Ratio is highly effective, it treats all volatility exactly the same. But here is the catch: investors only care about volatility when prices are crashing. Nobody complains when an asset spikes upward unexpectedly.
The Sortino Ratio solves this flaw by isolating downside deviation. Instead of penalizing an asset for all price movements, it only factors in harmful, negative fluctuations. This makes the Sortino Ratio an exceptionally practical metric for analyzing asymmetric strategies that capture plenty of upside momentum while running strict, tight risk caps on the downside.
The Treynor Ratio shifts the analytical lens away from total portfolio volatility and focuses entirely on systematic market risk.
The core formula is structured as:
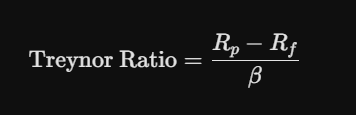
Here, Beta measures how sensitive your specific investment is to the broader macro tides. This metric is incredibly useful when you are evaluating highly diversified portfolios where company-specific, idiosyncratic risks have already been neutralized through smart asset allocation.
Jensen’s Alpha is designed to isolate pure investment skill from general market luck. Specifically, it calculates the difference between an asset’s actual performance and the return predicted by the Capital Asset Pricing Model (CAPM).
A positive Alpha means the manager actively generated excess returns through sharp asset selection or timing. A negative Alpha proves the strategy underperformed what the broader market tide should have naturally delivered based on the risk profile.
[ Actual Portfolio Return ] - [ Expected Market Beta Return ] = Jensen's Alpha (Pure Skill)
The Information Ratio measures an active manager's ability to consistently beat a specific benchmark index. Instead of looking at absolute returns, it divides the excess return by the "tracking error" (the volatility of those excess returns). A high Information Ratio proves a manager is outperforming their benchmark through steady, disciplined execution rather than taking random, outsized gambles.
Different market sectors naturally carry fundamentally unique risk-return signatures:
The power of risk-adjusted analysis becomes instantly clear when you look at how institutional wealth managers view performance:
| Investment Strategy | Total Annual Return | Realized Volatility | Risk-Adjusted Superiority |
| Portfolio A | 18% | High Swings | Lower Efficiency |
| Portfolio B | 15% | Moderate / Controlled | Higher Efficiency |
Even though Portfolio A walks away with the larger absolute gain, Portfolio B is the institutional winner. It generated its returns with far less operational stress, making it the mathematically superior foundation for long-term capital preservation.
Long-term investing is a marathon of survival, and deep drawdowns are the ultimate enemy of compound interest. The math of recovery is brutal: if your portfolio takes a 50% hit, you don't just need a 50% gain to break even; you need a massive 100% surge just to get back to your starting point.
[ 50% Portfolio Loss ] ──► Requires a [ 100% Market Rally ] Just to Break Even
Strategies that prioritize risk-adjusted efficiency keep your drawdowns shallow, allowing your capital to compound far more effectively over time.
Beyond the pure math, there is an immense psychological benefit. It is significantly easier to stick to an investment plan when your portfolio isn't dropping like a stone every few quarters. Minimizing emotional burnout saves you from making devastating tactical mistakes.
Retail investors regularly destroy their returns by looking at data upside down.
Avoid these classic analytical traps:
Expanding your risk-adjusted metrics doesn't mean you have to magically find assets that print more cash. Mostly, it's about systematically stripping out toxic, uncompensated risk.
You can optimize your portfolio's efficiency by diversifying across uncorrelated asset classes, keeping a tight grip on individual position sizes, avoiding unnecessary leverage, and minimizing the drag of high investment fees. True edge is built on consistent execution, not swinging for the fences on speculative bets.
While risk-adjusted formulas are incredibly valuable, they are not oracle blueprints. Most ratios rely completely on historical data, and past performance cannot predict future market anomalies.
Standard statistical metrics can easily fail to capture extreme, low-probability "Black Swan" events. A strategy can boast a flawless Sharpe Ratio for years right up until a sudden structural market shift changes the rules overnight. Ratios should be used to inform your broader analysis, never to completely replace human judgment.
Different metrics excel at answering very specific operational questions:
| Analytical Objective | Most Effective Metric | Core Focus |
| General Portfolio Evaluation | Sharpe Ratio | Total Volatility Efficiency |
| Downside Protection Review | Sortino Ratio | Harmful Downside Deviations |
| Diversified Equity Analysis | Treynor Ratio | Systematic Market Beta Sensitivity |
| Manager Skill Audit | Jensen's Alpha | Performance Beyond Pure Market Beta |
| Benchmark Consistency Check | Information Ratio | Tracking Error vs. Alpha Generation |
True investment success is never defined by returns alone. The most resilient, enduring portfolios are those engineered to secure solid gains while maintaining absolute control over risk exposure. A strategy that delivers slightly lower raw numbers but protects you from deep, devastating drawdowns is fundamentally more valuable than an erratic strategy built on excessive volatility.
By integrating tools like the Sharpe, Sortino, and Treynor ratios into your routine, you can step away from emotional tracking and evaluate your capital efficiency objectively. No single formula offers a complete solution to changing markets, but ignoring them means you are flying blind. Stop chasing the biggest numbers on the board. Focus on building a highly efficient, risk-mitigated engine that delivers sustainable performance over the long haul.
Why is looking only at total return dangerous?
Total return ignores the volatility you had to endure to get there. A portfolio with high returns but massive price swings exposes you to severe drawdown risks and emotional panic, whereas a slightly lower, stable return compounds wealth much more efficiently over time.
What is the main difference between the Sharpe and Sortino ratios?
The Sharpe Ratio evaluates an investment's excess return against its total volatility (both upside and downside swings). The Sortino Ratio only penalizes the investment for downside or negative volatility, making it a more accurate gauge for assets with high upward momentum.
Does a high Sharpe Ratio guarantee future profits?
No. All standard risk-adjusted metrics rely entirely on historical data, which cannot predict future market shifts or low-probability "Black Swan" events. A strategy can look highly efficient on paper right up until market conditions change.
How does a portfolio drop affect the math of recovery?
The math of investment loss is asymmetrical. If your portfolio suffers a 50% drawdown, you need a 100% return on your remaining capital just to break even, which is why minimizing downside risk is so critical for long-term growth.
How can I improve my portfolio’s risk-adjusted returns?
The most reliable method is asset diversification. By combining uncorrelated assets like stocks, bonds, and gold, you can structurally lower your portfolio’s overall volatility without forcing yourself to sacrifice your long-term return targets.
Would like to learn how to look financial markets from a different angle? Then keep reading and invest yourself with ZitaPlus.


")