


Sign up for ZitaPlus, where knowledge and personalized support come together for your success.
Open Real Account Open Demo Account
These three indices get mentioned together all the time. Headlines move between them as if they were interchangeable, but they are not. Each one reflects a different slice of the market, and more importantly, a different type of behavior.
If you trade them the same way, you will eventually feel something is off. One moves faster than expected, another barely reacts, and sometimes they even move in opposite directions.
That is not random. It usually tells you something about the market underneath.
So instead of treating them as three versions of the same thing, it helps to understand what each one actually represents in practice.
At first glance, this looks like a simple classification. In reality, these structural differences shape how each index behaves under pressure.
| Feature | S&P 500 | Dow Jones (DJIA) | Nasdaq 100 |
| Number of Stocks | 500 | 30 | 100 |
| Weighting | Market Cap | Price Weighted | Market Cap |
| Tech Exposure | ~30–35% | ~20% | ~50–60% |
| Volatility | Moderate | Low | High |
| Trader View | Benchmark | Stability / Value | Growth / Momentum |
The Dow Jones is the odd one out. Unlike the others, it is not based on company size. It is based on stock price.
That leads to a strange effect. A one dollar move in a high-priced stock has the same impact as a one dollar move in a much smaller company, even if their actual size is completely different.
Think about it this way. If a $500 stock moves by one dollar, it influences the index just as much as a $50 stock moving by one dollar. The market value behind those moves is not even close, but the index treats them equally.
This makes the Dow a bit unconventional. It still matters, especially for sentiment, but institutions do not rely on it as their primary benchmark. It can move in ways that do not fully reflect what the broader market is doing.
The S&P 500 and Nasdaq follow a more logical approach. They are weighted by company size. That sounds straightforward, but there is a catch.
In today’s market, the largest companies dominate both indices.
The top names in the S&P 500 account for a large portion of the entire index. The Nasdaq is even more concentrated. This means that even though the S&P can be described as “diversified,” it is still heavily influenced by a small group of companies. So the old idea that the S&P represents the broad economy while the Nasdaq represents tech is no longer fully accurate.
It is more like:
That difference still matters, but it is not as clean as it used to be.
If you line these three indices up by behavior, a pattern appears.
The Nasdaq reacts quickly. It tends to lead during strong rallies and fall harder during corrections. It is more sensitive to changes in sentiment and expectations. This is where you see momentum play out most clearly.
The S&P sits between the two extremes. It reflects the broader market and usually moves with a more balanced pace. It does not spike as aggressively as the Nasdaq, but it does not stay as calm as the Dow either.
The Dow is slower. It is made up of established companies, and its movements tend to be more controlled. It holds up better during uncertain periods. This makes it useful as a reference point.
One of the biggest differences between these indices shows up when interest rates change.
Technology and growth companies rely heavily on future earnings. Investors are buying into what these companies might generate years from now.
When interest rates rise, those future earnings become less valuable in today’s terms.
A simple way to think about it:
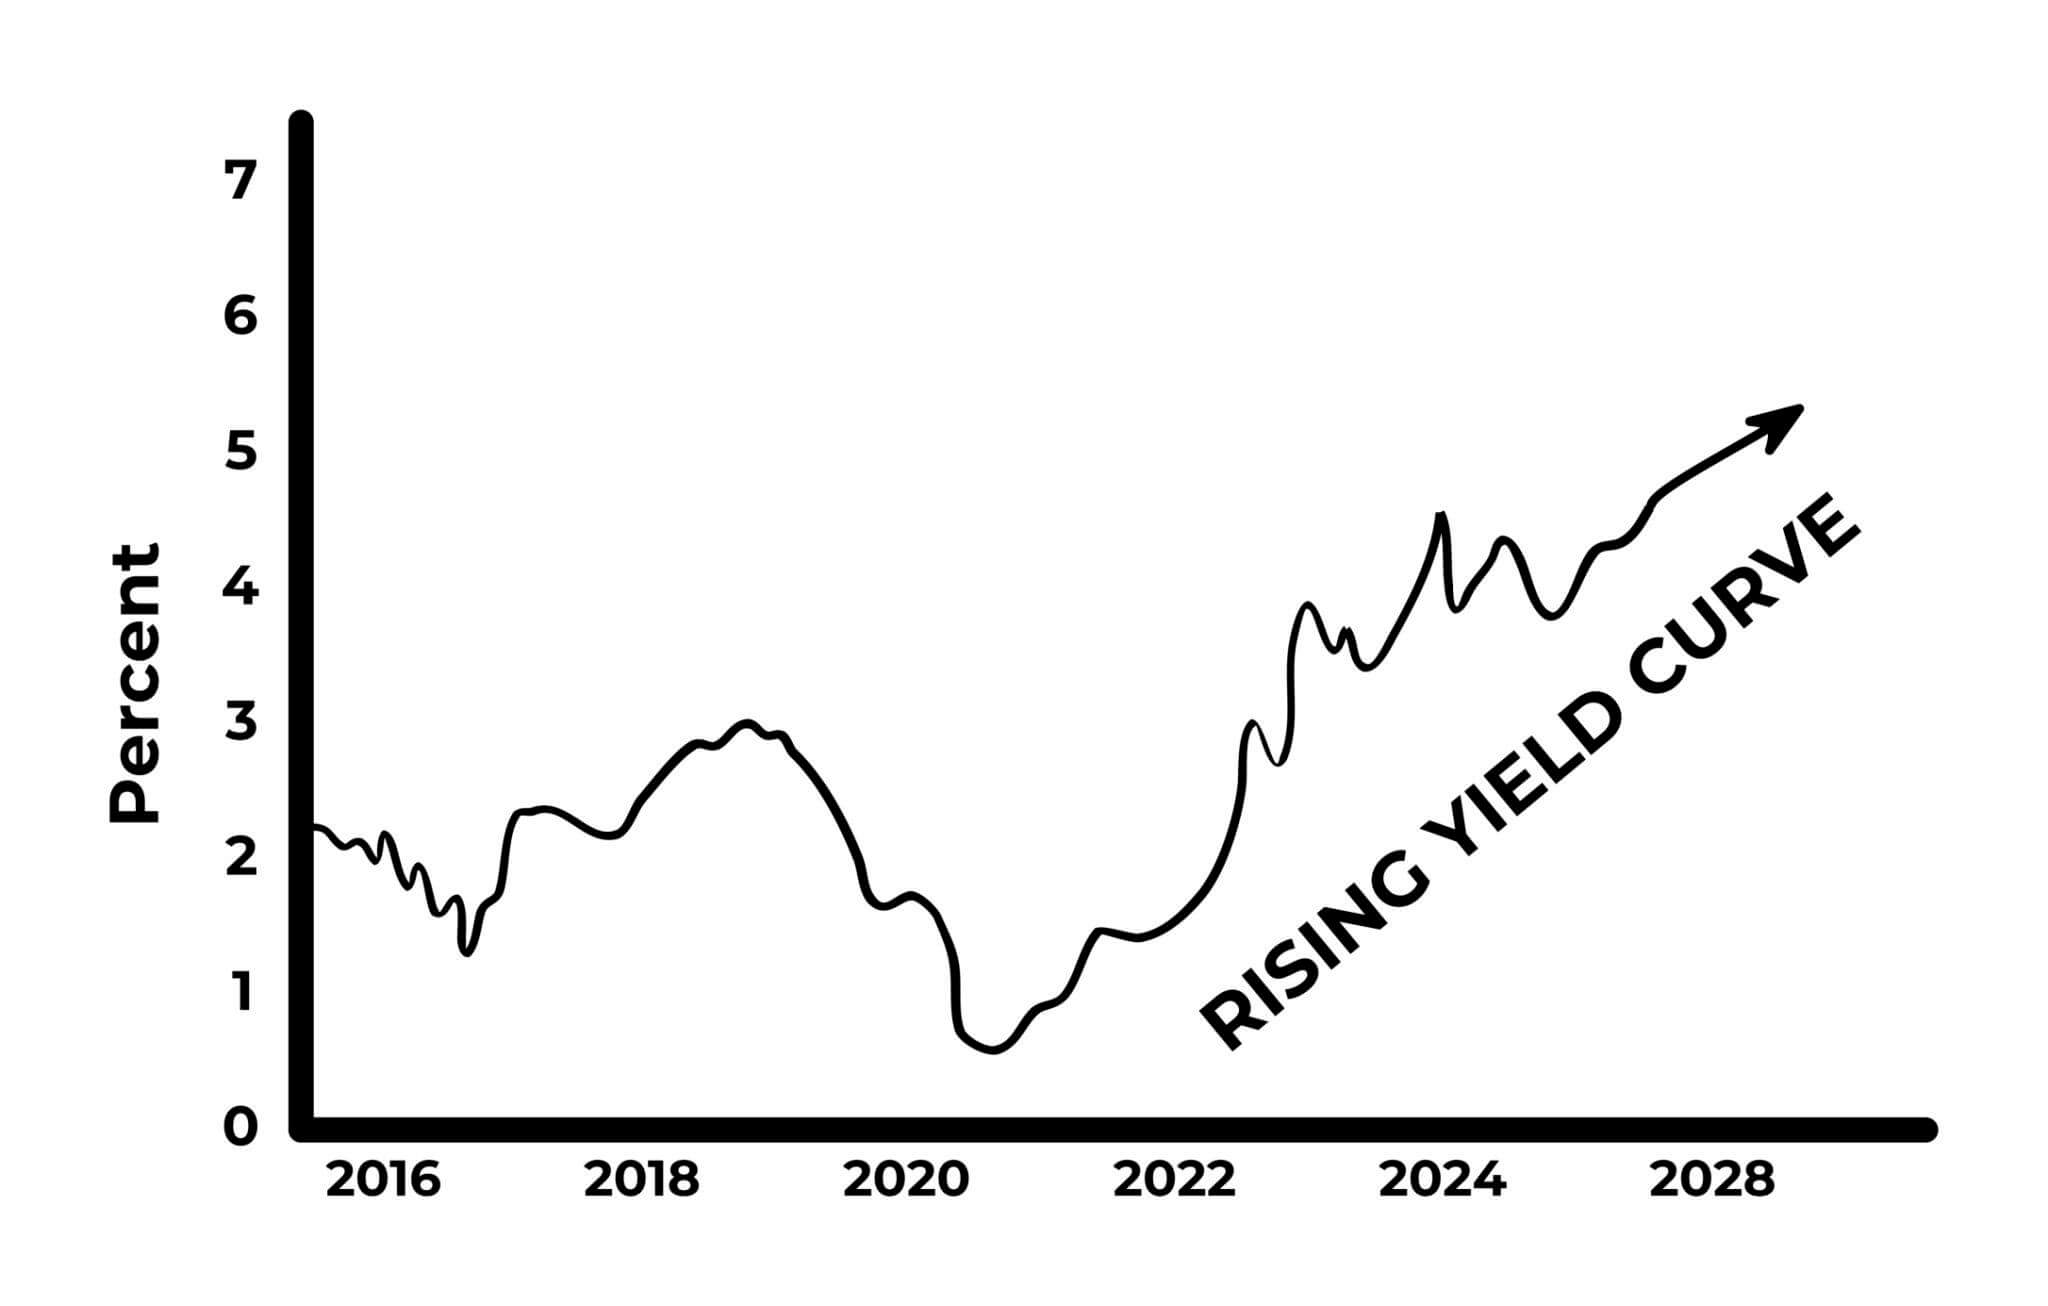
Higher rates increase the discount applied to future cash flows. That tends to push valuations lower.
This is why the Nasdaq can react strongly to moves in the 10-year Treasury yield. In a way, it behaves like a long-term asset that is very sensitive to interest rate changes.
The composition of each index plays a big role in how it reacts.
The Nasdaq is heavily tilted toward technology.
Software, semiconductors, and AI-related companies dominate its movement. It reflects future expectations more than current conditions.
The S&P includes multiple sectors.
It still has strong exposure to tech, but also includes financials, healthcare, energy, and more. This gives it a broader base.
The Dow leans toward traditional sectors.
Industrials, financials, and consumer companies are more prominent. These are tied more directly to current economic activity.
There are times when money moves between these indices in a noticeable way.
When interest rates stay high, growth stocks tend to struggle. At the same time, sectors like energy, finance, and industrials become more attractive.
This leads to a common setup:
It is not about predicting the overall market direction. It is about capturing the difference between two types of assets. When this rotation starts, it can last longer than expected.
Instead of overcomplicating things, it helps to think in terms of market mood.
In this environment, the Nasdaq tends to lead.
The S&P often becomes the main focus.
The Dow tends to hold up better. This framework is not perfect, but it provides a useful starting point.
There are times when all three indices move in the same direction.
Strong economic data or major policy changes can push everything higher or lower together. This happens in broad market moves. In these moments, differences between indices matter less.
More useful signals appear when they do not move together.
For example:
This usually indicates a shift in capital. Investors may be moving away from growth and toward stability. This kind of divergence can reveal what the market is really thinking.
Another factor that affects these indices is how money flows into them.
When a company is added to the S&P 500, funds that track the index must buy it. This creates immediate demand. It does not guarantee long-term performance, but it provides short-term support.
The Dow changes very rarely. Because of this, it does not experience the same type of mechanical buying pressure. This makes its movements less influenced by passive flows.
Each index requires a slightly different mindset.
The Nasdaq suits active conditions. It responds well to momentum and reacts quickly to changes in expectations.
A few practical points:
The Dow is more about stability. It tends to respect levels better and move in a more structured way. Some traders prefer it when markets are uncertain.
The S&P is the most balanced option. It is widely followed and has strong liquidity. It acts as a reference point for the overall market.
There is no single “best” index to trade. It depends on the situation.
Here’s a simple way to approach it:
This is not a rule, but it helps narrow things down.
Instead of trading direction, some traders focus on relationships.
It reduces exposure to the overall market direction. Instead of betting on the market going up or down, you are betting on one part outperforming another.
In recent years, something interesting has happened.
Because of the growing influence of large tech companies, the S&P and Nasdaq move in a similar way. The difference between them is still there, but it is smaller than before.
This leaves the Dow in a different position. It becomes more useful as a divergence indicator. If the Dow is rising while the Nasdaq is falling, it signals a shift in market preference.
These indices are not just different baskets of stocks, they reflect different layers of the market.
Understanding this changes how you read the market. Instead of reacting to movement, you start to see the reason behind it. And once you see that, choosing what to trade becomes a lot clearer.
Which index is best for beginners to trade?
The S&P 500 is usually the easiest starting point. It is more balanced and less volatile than the Nasdaq, while still offering enough movement to learn market behavior.
Why is the Nasdaq more volatile than the other indices?
Because it is heavily weighted toward growth and tech companies. These stocks react more strongly to changes in interest rates, earnings expectations, and overall sentiment.
Does the Dow Jones still matter if institutions don’t use it much?
Yes, it still matters as a sentiment indicator. Even if it is not the main benchmark, it can show how investors are positioning in more traditional, stable companies.
Can you trade these indices directly or only through derivatives?
Most traders access them through derivatives like CFDs, futures, or ETFs. You cannot buy the index itself, but you can trade instruments that track it.
Why do the S&P 500 and Nasdaq move together now?
Because large tech companies make up a significant portion of both indices. This overlap causes them to react similarly, especially during tech-driven market moves.
Would like to learn how to look financial markets from a different angle? Then keep reading and invest yourself with ZitaPlus.


