


Sign up for ZitaPlus, where knowledge and personalized support come together for your success.
Open Real Account Open Demo Account
In trading and investing, success is not only measured by how much profit a person makes, but by how well they handle losses as well. Every trader, regardless of skill or experience, will face challenging times when their portfolio value declines. These periods, called drawdowns, show how disciplined and consistent a trader is, just like their profitable trades do.
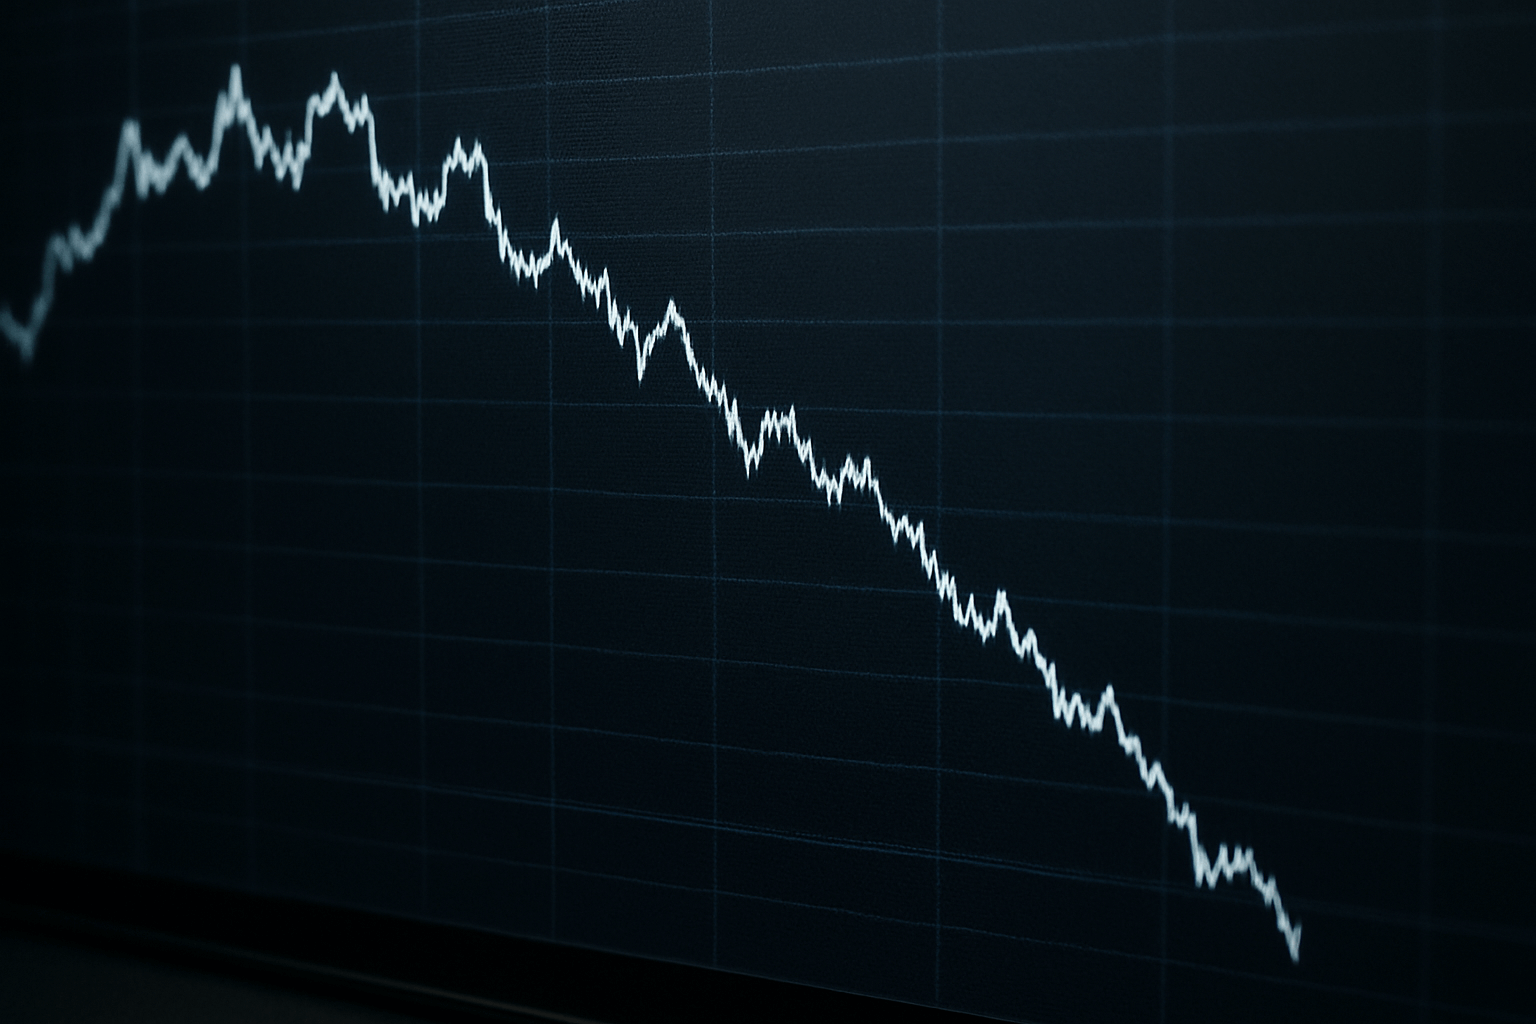
A drawdown measures the drop in an account’s value from its peak to its lowest point before it begins to recover. In other words, it reflects the distance between your highest equity and the next low that follows a losing streak. Understanding drawdowns is quite important because they directly impact both capital preservation and psychological stability. Even professional fund managers are evaluated not just by their profits, but by how much their portfolios drop during tough times.
Drawdowns are part of the financial landscape. They can happen due to market volatility, poor timing, or simply because a strategy temporarily stops performing well under certain conditions. What separates successful traders from the rest is how they manage these downturns and recover from them effectively.
A drawdown is usually expressed as a percentage and serves as one of the most important indicators of financial risk. Understanding drawdown helps traders and investors evaluate how much loss a strategy or portfolio can withstand during unfavorable market conditions.
The basic formula for drawdown is:
Drawdown (%) = ((Peak Value - Through Value) / Peak Value) x 100
For example, if a trading account rises to $10,000 and later drops to $8,000 before recovering, the drawdown is calculated as:
((10,000 - 8,000) / 10,000) x 100 = 20%
This means the account experienced a 20% drawdown from its peak.
Every drawdown includes a journey from a high point to a low point. The depth of that fall shows how much capital was lost before recovery. Once the value climbs above the previous peak, the drawdown is considered recovered. However, deeper drawdowns require much better percentage gains to return to the same level. We will touch upon this concept later in the article.
Among these, maximum drawdown is considered the most important because it helps investors measure the worst-case scenario. For instance, if a hedge fund has a historical maximum drawdown of 25%, it means that at some point, it lost a quarter of its value before recovering. Investors use this number to assess how much risk they are willing to accept.
Drawdowns reveal more than temporary losses. They clearly show the relationship between risk and return. A strategy that produces high returns but also suffers deep drawdowns may be riskier than one with smaller gains but stable performance. By monitoring drawdowns, traders can:
So, drawdown measurement is not about avoiding losses entirely, but about quantifying and managing them in a controlled way.
Drawdowns happen for many reasons. Knowing their causes is pretty helpful for traders to avoid losses. While some drawdowns are a natural part of market movement, others result from poor planning or emotional decisions. Recognizing these factors early is key to maintaining stability and confidence during tough periods.
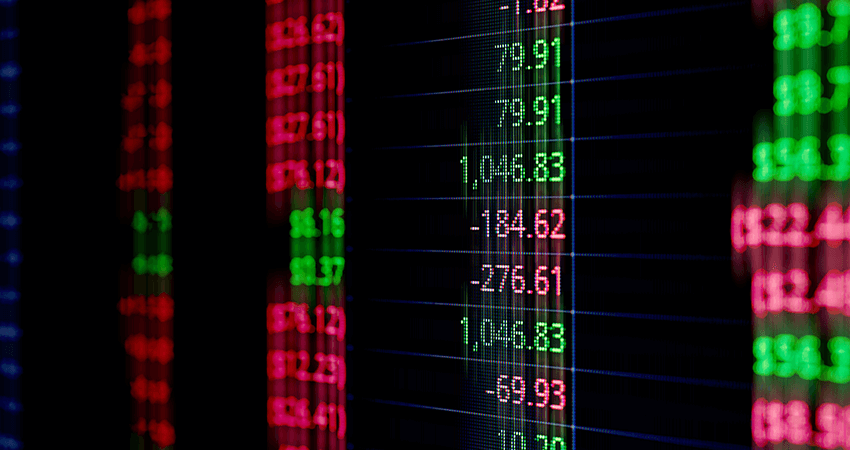
Financial markets are constantly changing due to shifts in supply, demand, and global events. High volatility can cause large price swings that trigger stop-loss orders or close positions at a loss. Even well-planned strategies can suffer temporary drawdowns during unpredictable conditions such as major economic releases or geopolitical tensions.
Overexposure to a single position or using too much leverage is one of the most common reasons for deep drawdowns. When traders risk a large portion of their account on one trade, a single loss can cause major damage. Setting position sizes too high relative to total equity increases vulnerability to sudden market reversals.
Fear, greed, and frustration can lead to rushed decisions. Traders who abandon their plans after a few losses or chase the market to recover quickly often worsen their drawdowns. Emotional trading typically replaces logic with reaction, which turns temporary setbacks into extended declines.
Unexpected global developments can affect asset prices quite heavily. Events such as central bank announcements, wars, or economic crises create sharp and immediate price movements. During such times, even strong strategies may experience losses due to sudden changes in sentiment and liquidity.
No trading strategy performs well under all market conditions. A system that works in trending markets might fail when markets move sideways or become range-bound. Drawdowns can happen simply because market conditions have shifted, not necessarily because of a failing strategy.
For traders using automated systems or high-frequency strategies, technical malfunctions, data errors, or connectivity issues can also cause losses. In manual trading, poor timing or delayed execution can have a similar effect, especially in fast-moving markets.
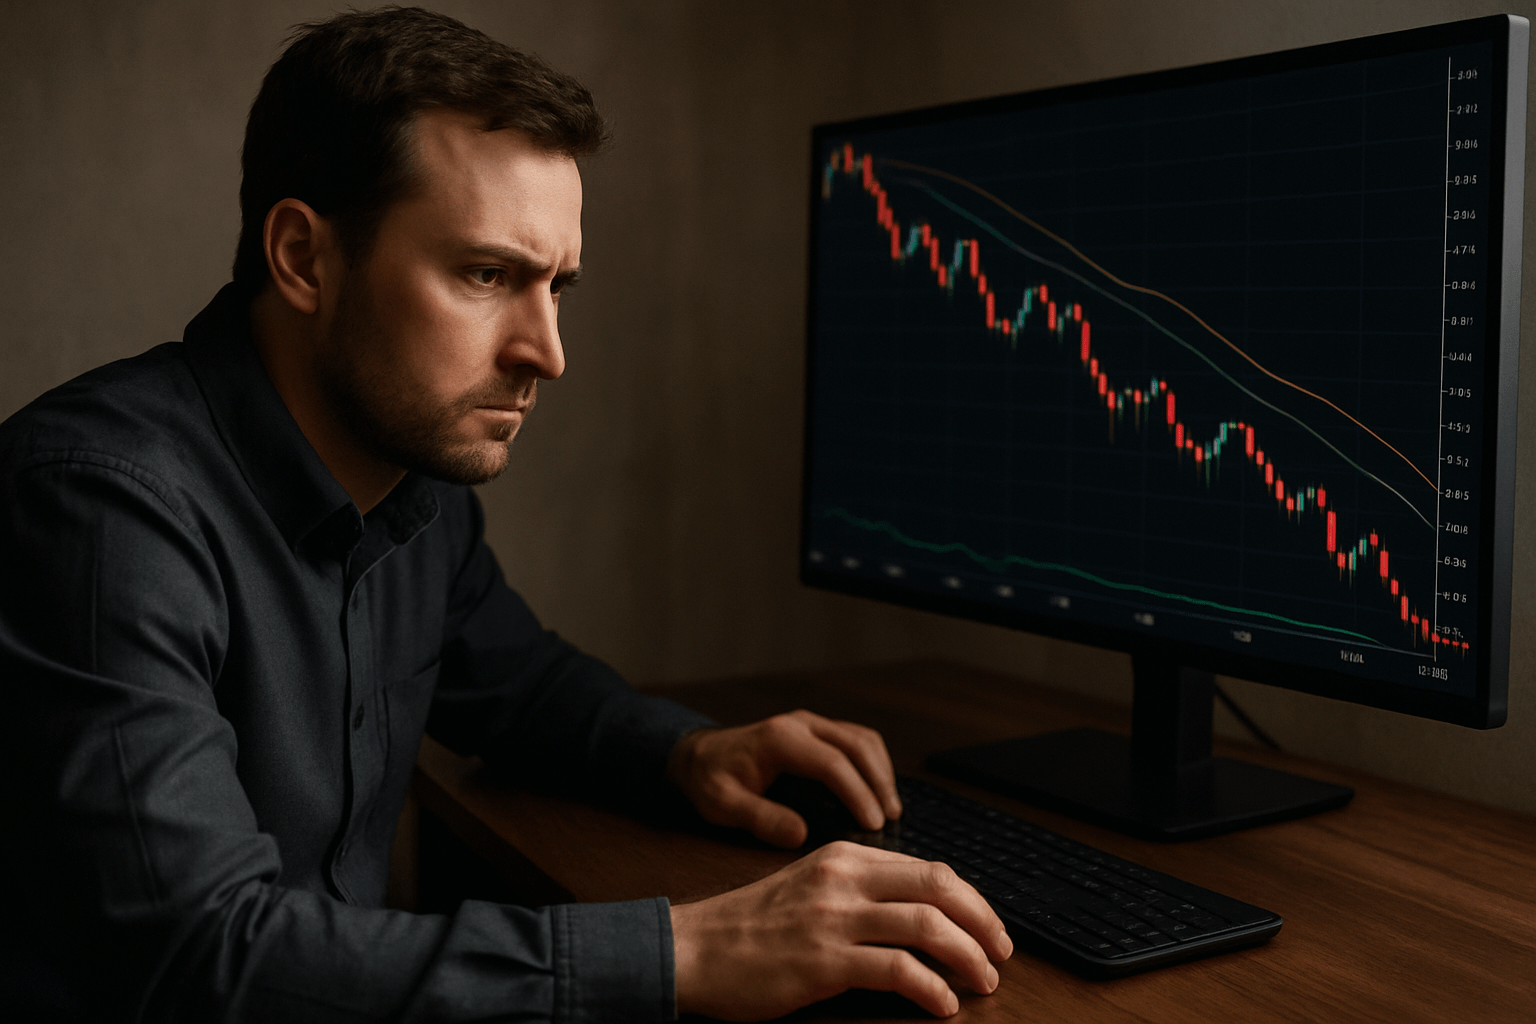
Drawdowns affect traders in more ways than just financial loss. Emotions, confidence, and decision-making are affected by drawdowns. The depth and duration of a drawdown can determine how a trader reacts, adapts, and grows from the experience. Now let’s take a look at some of the most effective impacts.
The most direct effect of a drawdown is a reduction in capital. When an account balance declines, traders lose not only money but also the ability to open positions of the same size as before. Smaller equity means smaller potential profits. It may also take longer to recover, since the percentage gain required to reach the previous peak is greater than the percentage loss taken. For example, losing 20% of the account requires a 25% gain to recover. This mathematical imbalance highlights why capital protection is more important than short-term profit chasing.
Drawdowns can cause stress, frustration, and self-doubt. Watching the account decline can lead to emotional decision-making, such as closing positions too early or entering new trades out of desperation. Many traders describe this as “revenge trading,” where the goal shifts from following a plan to trying to quickly win back losses. This mindset usually results in deeper drawdowns. Maintaining psychological control during a losing period is one of the hardest yet most valuable skills in trading.
Drawdown levels are critical performance indicators for fund managers, prop traders, and portfolio managers. Investors and institutions track metrics like maximum drawdown to evaluate risk. A professional trader may deliver strong returns, but if the drawdowns are deep or frequent, it signals instability. Many funds set strict limits, and exceeding them can lead to reduced capital allocation or termination of the strategy.
Experiencing a drawdown often changes how traders view risk. Some become overly cautious and avoid trades even when conditions are favorable, while others become reckless, trying to recover losses too fast. Both extremes can be damaging. The key is to maintain balance: accept that drawdowns are part of trading but stay consistent with a well-defined risk management plan.
Repeated or severe drawdowns can harm confidence and lead to burnout. It may cause a trader to leave trading altogether. However, those who analyze their losses, learn from mistakes, and refine their methods tend to come back stronger. In this sense, drawdowns can serve as valuable feedback, guiding traders toward more mature, disciplined decision-making.
Measuring drawdowns helps traders understand how much their account or portfolio has declined during tough periods. It also provides a clear picture of how risky a strategy is and how well it performs over time. Tracking drawdowns is important for both evaluating past performance and planning for the future.
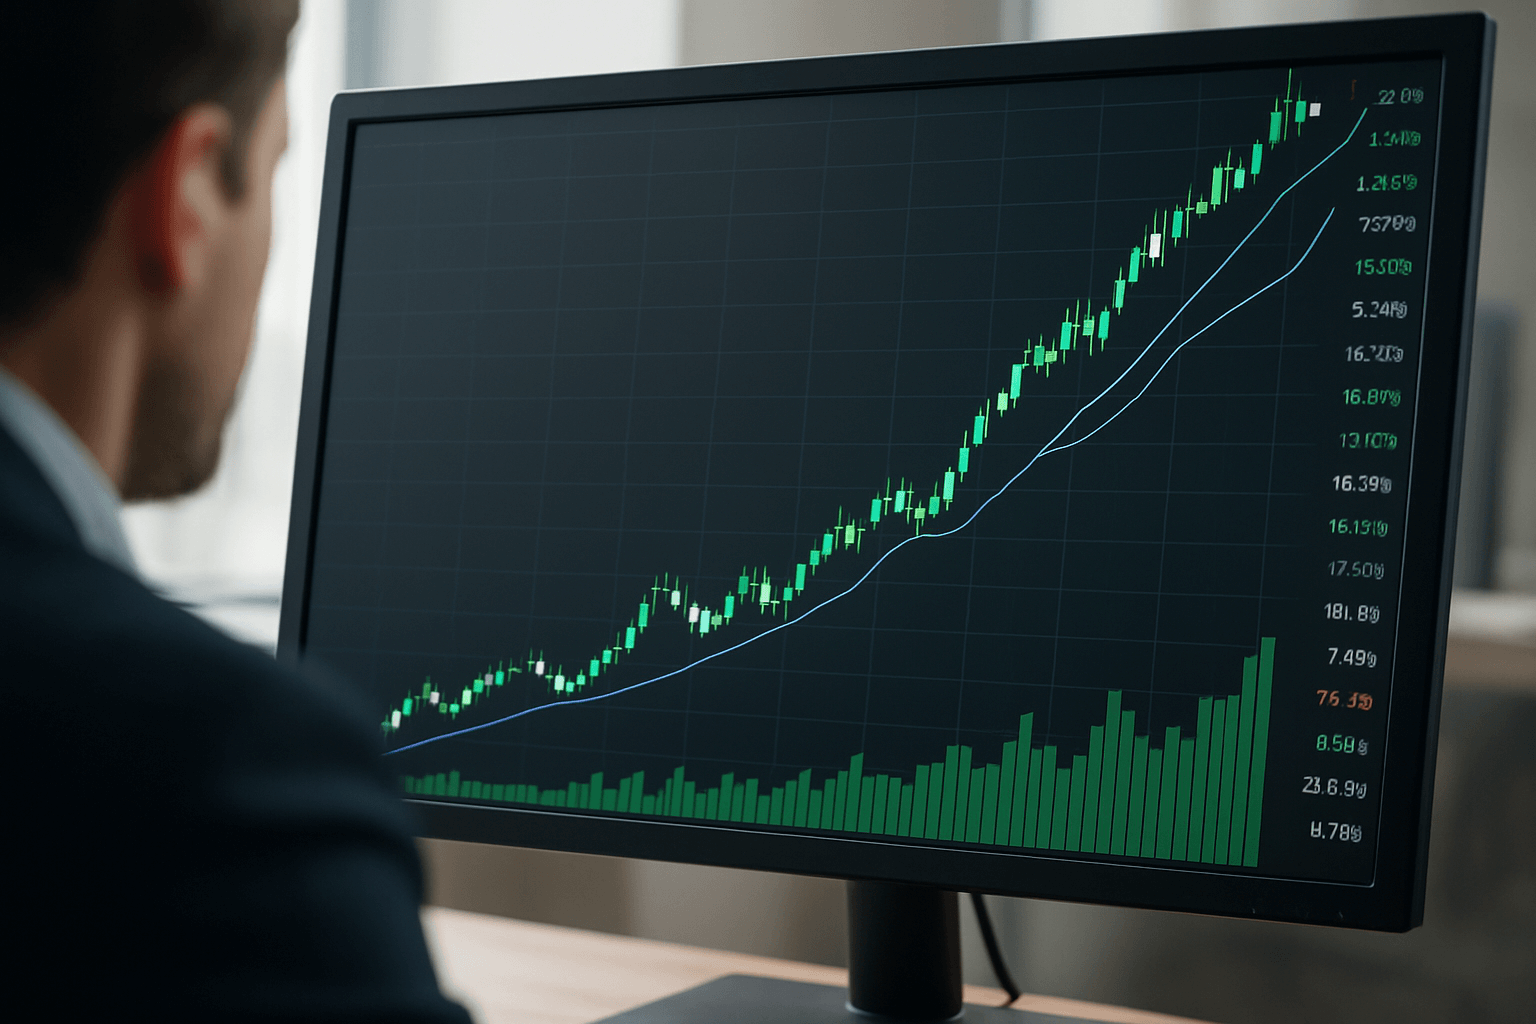
Most trading platforms and portfolio tracking tools display equity curves that show how an account balance changes over time. A drawdown appears as a dip in this curve. By examining these dips, traders can determine:
These insights are useful for identifying weaknesses in a strategy and understanding how it behaves under different market conditions.
One of the most important metrics is maximum drawdown, which measures the largest peak-to-trough decline over the evaluation period. It shows the worst-case scenario a trader or investor has experienced. For example, if a fund dropped from $500,000 to $350,000 before recovering, the maximum drawdown for that period is 30 percent.
Maximum drawdown helps investors compare strategies. A system with high returns but a maximum drawdown of 50 percent may be less appealing than a system with moderate returns but a maximum drawdown of 10 percent. The latter suggests more stability and lower risk.
Drawdowns should always be analyzed together with returns. A strategy that produces strong annual gains but suffers deep drawdowns may require a strong emotional and financial tolerance. Traders compare average yearly returns with maximum drawdown to understand the balance between reward and risk.
For example:
This comparison helps traders assess whether a strategy aligns with their personal risk tolerance.
Advanced tools such as portfolio backtesting software and hedge fund reporting systems also provide detailed drawdown statistics. These reports may show:
These insights guide traders in improving their strategy, refining position sizing, and adjusting risk settings.
Drawdowns are not limited to individual traders. They are present in global markets, investment funds, and across all asset classes. Let’s take a look at some real-life examples to see how drawdowns form, how long they can last, and how different market participants eventually recover from them.
The financial crisis of 2008 caused one of the largest drawdowns in modern history. Major stock indexes around the world fell sharply as banks collapsed and credit markets froze.
This period showed how even diversified portfolios can experience deep drawdowns when global confidence collapses.
When the pandemic began, global markets experienced extreme volatility. Lockdowns disrupted supply chains, travel, and consumption.
Although the drop was fast, recovery also happened quickly once governments and central banks stepped in with support measures.
Drawdowns mostly happen due to personal decision-making. A common example is a forex trader who risks too much on a single position.
Imagine a trader with a $5,000 account who uses high leverage to open a large EUR/USD position. A normal market correction of 50 or 60 pips can quickly cause a 20 percent loss. If the trader reacts emotionally by increasing position size to recover faster, the account may suffer an even deeper drawdown. This situation is typical for beginners who underestimate how quickly leverage can amplify losses.
Professional funds also experience drawdowns. Some well-known hedge funds have reported temporary declines of 10 to 20 percent due to unexpected market conditions. Successful funds recover by sticking to their systems, reducing exposure, or reallocating capital into stronger opportunities. These examples show that drawdowns are not the end of a strategy but moments that require discipline and adjustment.
Gold, oil, and agricultural commodities can face sharp downturns due to global events. For example, gold experienced significant drawdowns between 2012 and 2015 as investor sentiment shifted and the US dollar strengthened. Traders who held long-term positions needed patience and strict risk control to manage these declines.
Recovering from a drawdown requires a structured approach. The goal is not only to regain lost capital but also to rebuild confidence, improve discipline, and ensure that the same mistakes do not repeat. Effective recovery starts with understanding what caused the drawdown and adjusting the strategy with clarity rather than emotion. Here are the basic techniques:
The first step is to identify what went wrong. Traders should review charts, entry points, position sizes, and market conditions during the drawdown. The key question is whether the losses happened because the market changed or because the strategy was not followed correctly.
A temporary market shift may require minor adjustments, while a deeper issue in the strategy may require a full review.
Lowering position size is one of the safest ways to regain control. Smaller trades reduce risk and allow the trader to focus on the process rather than pressure. Many professionals temporarily cut their position size by half during recovery periods to stabilize performance.
Trying to recover losses quickly often leads to even bigger drawdowns. Traders should avoid impulsive decisions and return to their original plan. A calm, systematic approach allows the account to recover slowly and consistently.
Diversification can reduce the chance of experiencing another sharp drop. Instead of placing multiple trades in one currency pair or asset, traders can spread positions across different markets. This lowers the impact of a sudden move in one direction.
During recovery, traders should favor setups with a higher probability of success and a clear risk-to-reward structure. For example, choosing trades with a 1:2 or 1:3 ratio helps regain equity steadily while keeping losses limited.
Recording every trade, including the reason for entering and exiting, helps reveal patterns behind losses. Many traders discover that emotional reactions or rushed decisions caused the drawdown. A journal provides transparency and accountability, making recovery more structured.
Sometimes the best recovery technique is stepping away from the market. A short break helps reduce emotional pressure and allows traders to return with a clear mindset. This prevents impulsive decisions and improves overall performance once trading resumes.
Recovering from a drawdown is harder than it seems because losses and gains do not move at the same rate. When an account drops in value, a larger percentage gain is needed to return to the previous peak. This simple mathematical reality highlights why controlling losses is more important than chasing big profits.
When the account value falls, the base amount becomes smaller. Any recovery must grow from this reduced level, which increases the percentage required.
Examples:
The deeper the drawdown, the steeper the climb back. This is why professional traders prioritize capital protection over aggressive trading.
Drawdowns slow the compounding process. Even if a trader eventually recovers, time spent rebuilding reduces overall growth. Strategies that avoid steep declines often produce smoother, more reliable performance over the long term.
The math behind recovery encourages traders to limit losses early and avoid excessive risk. A stable account curve is far easier to manage psychologically and financially than one with sharp swings.
While drawdowns are a natural part of trading, severe declines can be avoided with disciplined planning and consistent risk control. Prevention is always easier than recovery, which is why traders focus heavily on limiting losses before they grow too large.
Drawdowns are more than just temporary declines in account value. They are moments that test discipline, emotional control, and the strength of a trading strategy. Every trader experiences them, yet only those who approach them calmly and analytically are able to recover with confidence.
A drawdown does not signal failure. It reflects the natural rhythm of the market and the challenges that come with risk-taking. By understanding what causes these declines, learning how to measure them, and applying structured recovery techniques, traders can transform setbacks into valuable experience. Over time, this knowledge leads to better judgment, stronger strategies, and a more consistent trading journey.
The most successful traders are not the ones who avoid losses entirely. They are the ones who handle losses with clarity with improved discipline.
What is risk-adjusted return, and why is it important?
Risk-adjusted return measures how much profit a strategy generates relative to the risk taken. It helps traders compare strategies with different volatility levels and identify which one offers more stable results.
How does volatility affect trading strategies?
High volatility increases price fluctuations, which can create both opportunities and risks. Some strategies perform well in volatile markets, while others require stable conditions. Understanding volatility helps traders choose suitable setups.
Why do some traders use fixed fractional position sizing?
Fixed fractional sizing adjusts trade size based on account equity. As the account grows or shrinks, the position size changes. This method allows for controlled risk and smoother long-term performance.
What is the difference between realized losses and unrealized losses?
Realized losses occur when a trader closes a losing position. Unrealized losses remain open and may change as the market moves. Understanding the difference is important for accurate risk assessment.
Why do traders analyze their equity curve?
An equity curve shows the progression of account value over time. Traders study it to identify patterns, periods of instability, or signs that a strategy may need adjustment.
How can diversification reduce trading risk?
Diversification spreads capital across different markets or instruments. This lowers the impact of a sudden move in any single asset, helping to create a more stable trading performance.
What role does trade frequency play in performance?
Too many trades can increase transaction costs and emotional stress, while too few may limit opportunities. Finding a balanced trade frequency helps maintain consistent execution and risk control.
Would like to learn how to look financial markets from a different angle? Then keep reading and invest yourself with ZitaPlus.


