Start Trading Now
Sign up for ZitaPlus, where knowledge and personalized support come together for your success.
Open Real Account Open Demo Account
Placing a trade almost always comes down to answering two straightforward questions. Where is the asset heading right now? And how much power is actually behind that move? While those questions sound simple on the surface, confusing the answers is one of the quickest ways to lose money in modern technical analysis.
To make sense of raw price charts, active traders split market behavior into two distinct concepts: direction and strength. Direction points out the current path of least resistance. Strength tells you whether big market players are actually backing up that move with real money.
Before diving into how these two metrics work together, let's break down what each term actually means on a live price chart.
┌──► Trend Direction ──► Path (Up, Down, Sideways) Price Action ───┤ └──► Trend Strength ──► Conviction (Weak, Strong, Overextended)
Trend direction is simply the overall vector of price over a specific timeframe. It shows you where an asset is traveling, usually falling into one of three buckets: bullish, bearish, or sideways consolidation.
When a stock continually carves out higher highs and higher lows, the direction is clearly up. When it keeps printing lower highs and lower lows, the direction is down. Direction gives you your baseline bias, helping you figure out whether you should be hunting for buy setups or looking to open short positions.
Trend strength measures the sheer velocity and participation backing up that direction. It completely ignores where price is going and focuses purely on how aggressively buyers or sellers are driving the bus.
An asset can climb at a sluggish, grinding pace with tiny volume, or it can rocket upward on massive volume and wide price bars. Both charts technically share the exact same trend direction, but their underlying strength is night and day. Strength gives you crucial context on sustainability, showing whether a run has room to breathe or is running on empty.
Relying strictly on trend direction leaves a massive blind spot in your chart analysis. A market's direction can easily stay upward even while its internal energy completely drains away, creating a scenario technical traders refer to as a divergence.
Think about tossing a heavy ball straight up into the air. For the first few seconds, it rockets upward with full force. But as gravity takes over, the ball slows down until it briefly hovers at its absolute highest point before plummeting back down. If you only look at the ball's location in the sky, you would say it is high up and still moving higher. But if you look at its deceleration, you realize it has zero power left and is about to turn over.
In trading, buying an uptrend that lacks strength is just like trying to catch a ball right as it reaches that stalling point. Prices might still tick up to touch a fresh high, but without institutional volume and aggressive buying behind the push, the move is a sitting duck for a sharp reversal.
Traders use a mix of trend-following overlays and momentum oscillators to decouple direction from sheer power.
| Metric Type | Primary Focus | Common Technical Tools | Key Signals |
| Directional Indicators | Identifying market orientation | Moving Averages (EMA/SMA), Trendlines, Parabolic SAR | Price above key moving averages, structural higher highs |
| Strength Indicators | Measuring rate of change and conviction | Average Directional Index (ADX), RSI, Volume, ATR | ADX values above 25, volume expansion on breakout candles |
| Hybrid Tools | Combining vector and velocity | MACD, Ichimoku Kinko Hyo | Histogram expansion, cloud thickness, signal line crossovers |
To measure trend strength without getting biased by market direction, analysts frequently turn to the Average Directional Index (ADX). The ADX strips out direction entirely, outputting a value from 0 to 100 regardless of whether the market is climbing or falling.
The indicator relies on the Positive Directional Indicator (+DI) and Negative Directional Indicator (-DI), calculated using true range (TR) alongside directional movement (DM):
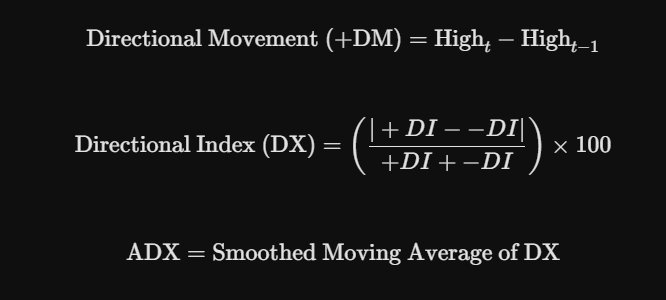
An ADX score crossing above 25 usually points to a healthy, trending market, while anything sitting under 20 hints at a choppy or dead environment. Keep in mind that an ADX reading of 50 during a brutal market crash means the downward push is wildly intense, not that the market is sitting at neutral.
Looking at how these two variables overlap gives you a much better mental map of how price behaves across four common market environments.
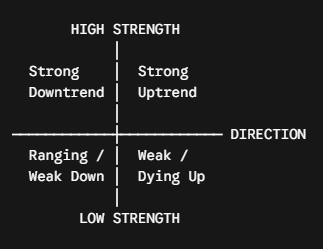
This is the golden zone for traditional trend-following systems. Price tracks cleanly in one direction with full-bodied candles, steady volume, and shallow pullbacks. Whether you prefer buying dips in a bull market or shorting rallies in a bear market, strong momentum provides the push needed to hit profit targets quickly.
This combination usually flashes late-stage market fatigue. Price might keep inching higher or lower, but the candle bodies shrink, volume thins out, and momentum oscillators like the Relative Strength Index (RSI) start printing lower peaks. This tells you to tighten up stop losses and stop opening fresh positions in the direction of the trend.
When clear directional conviction vanishes, but market power stays high, volatility goes wild. You usually see this in broad rectangle patterns, violent whipsaws, or initial news reactions where buyers and sellers clash hard without either side taking control.
This is your typical low-volatility, sideways grind. Price floats around in a tight horizontal box on low trading volume. Trend-following strategies usually suffer endless small paper cuts here as false breakouts chop traders up.
Teasing apart velocity and vector changes how you manage open risk on the desk.
Becoming a better technical analyst means treating direction and strength as two parts of a single equation. Direction answers where the price wants to head, while strength answers how much fuel it has left to get there.
By evaluating both factors side by side, you avoid chasing exhausted moves right at market tops or bottoms. Pairing strength metrics with traditional trendline analysis gives your trading plan a much sharper filter, keeping your capital sidelined until both path and power are pulling in the same direction.
Can a trend continue even if trend strength is low?
Yes, markets can drift upward or downward for surprisingly long periods on weak strength. However, these slow, low-volume moves are fragile and leave price vulnerable to sudden, violent reversals when aggressive buyers or sellers step back in.
Which indicator is best for measuring trend strength?
The Average Directional Index (ADX) is widely considered the gold standard because it isolates velocity from direction. Pair it with raw volume and Average True Range (ATR) to get a complete picture of market participation and volatility.
Does a declining ADX mean the market is reversing?
Not necessarily. A falling ADX simply means the current trend is losing momentum or entering a consolidation phase. Price might move sideways to build a new base before resuming its original path rather than reversing outright.
How do I tell if a breakout has genuine trend strength?
Look for a sharp expansion in candle size paired with above-average trading volume on the breakout bar. If the ADX turns upward from below 20 at the same time, it confirms that fresh institutional capital is driving the new direction.
Would like to learn how to look financial markets from a different angle? Then keep reading and invest yourself with ZitaPlus.