


Sign up for ZitaPlus, where knowledge and personalized support come together for your success.
Open Real Account Open Demo Account
The S&P 500 is treated as a simple benchmark. If it goes up, the market is strong. If it drops, something is wrong. That idea is not incorrect, but it is incomplete.
In reality, the S&P 500 is not just a reflection of the market. It is also shaped by how money flows into it, how it is structured, and how a handful of large companies influence everything else.
If you look at it only as an average of 500 stocks, you miss the point. It behaves more like a system. And once you start seeing it that way, the way it moves begins to make more sense.
The S&P 500 tracks 500 large companies in the United States. It is weighted by market value, which means larger companies have more effect on the index.
That is the basic definition, but the important part is how that plays out.
A few companies carry a large portion of the weight. Their movement can lift or drag the entire index. So even though there are hundreds of stocks inside it, the index does not move evenly.
This is why two traders can look at the same market and come to different conclusions. One sees broad participation, the other sees a handful of leaders doing all the work.
The S&P is usually described as diversified. It is, but not in the way many people expect.
The index includes multiple sectors:
At first glance, this looks balanced. But in practice, the weights are not equal.
Technology carries a significant portion of the index. This alone changes how the S&P behaves, especially during strong trends.
In recent years, the largest companies have taken a bigger share of the index. The top names can account for around one third of the total weight. That is a large number when you think about it. This creates a situation where the index is both diversified and concentrated at the same time. You are exposed to many companies, but a small group still drives most of the movement.
There is an interesting side effect here. Investors may think they are diversifying by buying the S&P 500. In reality, they are getting heavy exposure to a few large tech companies, along with a mix of other sectors.
So instead of pure diversification, it becomes something closer to a tech-focused portfolio with a built-in buffer. That buffer helps during certain conditions, but it does not eliminate concentration risk.
The idea of market cap weighting sounds simple. Bigger companies have more influence. But it helps to see what that means in real situations.
Imagine this:
The index may still finish the day positive. This is not a rare scenario. It happens more frequently than people expect. The takeaway is straightforward.
To understand the S&P, you need to watch the largest components. The rest still matters, but they do not carry the same weight. Some traders call this the “generals and soldiers” idea. The generals lead. The soldiers follow.
One of the most important features of the S&P is something that does not show up on a chart. It is the steady flow of money into the index.
Every month, large amounts of capital enter the market through retirement accounts, pension funds, and index-tracking products.
This money is not trying to time the market. It buys regardless of price. That creates a constant layer of demand.
This flow acts as a kind of support. When the market drops, these inflows continue. Over time, they help stabilize the index. This is one reason why the S&P recovers faster than individual stocks after a decline. It has a structural advantage that many other assets do not have.
The S&P does not move randomly. It responds to a combination of factors.
Corporate earnings still matter. Over the long term, companies that grow their profits tend to support higher index levels. But markets move ahead of earnings. Expectations lead price.
Interest rates have become one of the most important drivers. There is a clear relationship between the S&P and the 10-year Treasury yield. When yields rise, equities tend to face pressure. When yields fall, equities find support.
A simple way to think about it:
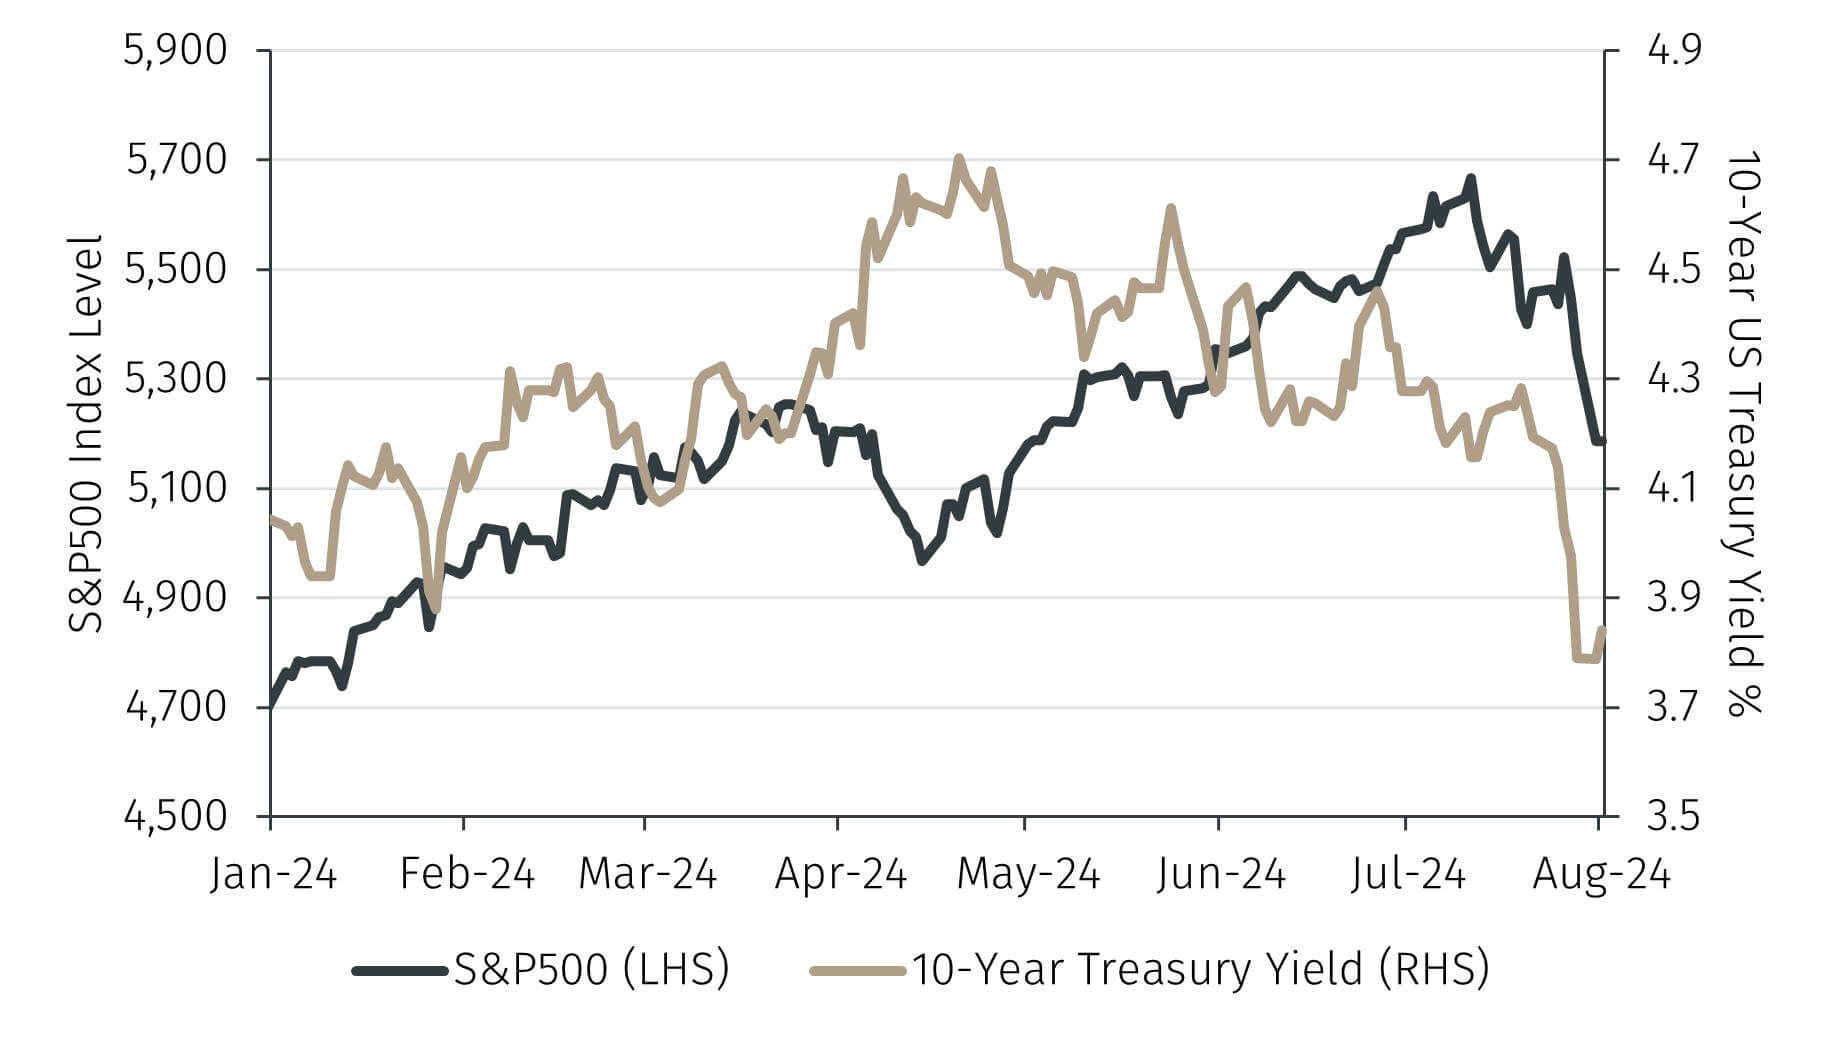
Higher yields increase the return available in safer assets. That makes equities less attractive in comparison.
There is also a valuation effect. Future earnings are discounted more heavily when rates rise. That reduces present value.
In recent conditions, a certain range in yields has acted as a pressure point. When the 10-year yield moves toward the higher end of that range, equities struggle to move higher. It does not act as a fixed ceiling, but it influences sentiment.
Central bank policy plays a major role. More liquidity supports higher asset prices. Tightening removes support. This is why policy shifts lead to strong market reactions.
Money moves across regions and asset classes. When global investors favor equities, the S&P benefits. When they move toward safer assets, it faces pressure.
Understanding what drives the S&P is one thing. Seeing how it behaves day to day is another.
There is a cycle that usually plays out:
The opposite can also happen during declines.
Because of concentration, the S&P moves in line with major technology stocks. This does not mean it is identical to a tech index, but the influence is strong enough to matter.
If the largest companies are moving strongly, the index will usually follow. If they are flat or weak, it becomes harder for the index to trend.
Trading the S&P is not just about direction. It is also about how you access it.
There are several ways to trade it:
The key difference is not what they are, but how they behave. Futures tend to offer tight spreads and deep liquidity. They are widely used by institutions.
CFDs are more flexible but come with overnight costs. ETFs are slower and used for positioning rather than active trading. Choosing between them depends on your style and time horizon.
A newer feature has changed how the S&P behaves during the day.
Options that expire on the same day now make up a large portion of trading activity. This has introduced new dynamics.
Prices can get pulled toward certain levels where options positioning is concentrated. This can create periods where the market feels “stuck.” Then, later in the session, movement can accelerate quickly.
The last part of the trading day sees stronger moves. Midday can feel slower or more controlled. Recognizing this pattern helps avoid unnecessary trades.
Timing matters as much as direction.
The US session is the most important. Liquidity increases, and most of the meaningful movement happens during this time.
Economic data releases can create strong moves:
These events shift expectations, which then move the index.
Trending markets tend to offer clearer opportunities. Sideways markets can be more difficult, as price moves without strong direction.
It helps to see the S&P in relation to other indices.
The S&P sits in the middle. It captures growth, but with some stability.
The S&P does not exist in isolation.
The Nasdaq is more concentrated in growth and technology. It moves faster and reacts more strongly to changes in expectations. The S&P includes those same companies, but also adds balance.
The Dow focuses on more traditional companies. It tends to move more slowly and reflects current economic conditions rather than future expectations.
Choosing between these indices depends on the environment. Aggressive conditions favor the Nasdaq. Defensive conditions favor the Dow. The S&P becomes the default option.
Different approaches work depending on the situation. Let’s take a look at the main ones.
For example:
This focuses on relative performance rather than absolute movement.
The S&P has built-in mechanisms that affect price.
When a company is added, funds tracking the index must buy it. This is called index additions. It creates immediate demand.
There’s also rebalancing. Weights are adjusted periodically. The changes can create predictable flows. For traders, these events can offer short-term opportunities.
The S&P is widely used, but it is not perfect.
Instead of overcomplicating things, a simple checklist can help.
These questions can explain more than the price alone.
The S&P 500 is not just a benchmark. It is a reflection of how money moves through the market. It reacts to expectations, policy, and flows, not just data.
Once you start looking at it this way, the movement becomes less random. And trading it becomes less about guessing and more about understanding what is already happening beneath the surface.
Is the S&P 500 a good indicator of the overall market?
It is a strong benchmark for large US companies, but it does not fully represent the entire market. Smaller companies and certain sectors are not included, and large tech firms have a bigger influence than many realize.
Why does the S&P 500 sometimes rise even when many stocks are falling?
Because it is weighted by company size. If a few large companies move higher, they can offset declines in many smaller components.
How closely does the S&P 500 follow interest rates?
Quite closely in recent years. Rising bond yields pressure the index, while falling yields tend to support it, especially during periods of uncertainty.
Is trading the S&P 500 better than trading individual stocks?
It depends on the approach. The S&P offers broader exposure and smoother trends, while individual stocks can provide sharper moves but come with higher risk.
What is the best time of day to trade the S&P 500?
The US session is the most active. The opening hours and the final part of the session provide the most movement and liquidity.
Does the S&P 500 behave like a tech index now?
To some extent, yes. Large technology companies have a strong influence, which means the index can move similarly to tech-heavy markets during certain periods.
Would like to learn how to look financial markets from a different angle? Then keep reading and invest yourself with ZitaPlus.


