Start Trading Now
Sign up for ZitaPlus, where knowledge and personalized support come together for your success.
Open Real Account Open Demo Account
Technical analysis gives traders dozens of tools to pick from, but very few have stayed as relevant over the decades as Bollinger Bands. Developed by John Bollinger in the early 1980s, this indicator tackles two major market factors at once: price direction and volatility. While plenty of standard indicators lag behind price movements, Bollinger Bands stretch and contract right alongside shifting market conditions. This gives you a clear, real-time look at whether an asset is sitting at relatively high or low price levels.
When you know how to read these bands properly, you can spot overbought or oversold conditions quickly, catch breakouts before they fully take off, and judge whether a trend actually has legs. It doesn't matter if you trade stocks, forex, commodities, or crypto; getting comfortable with this tool makes reading price charts much more intuitive.
Put simply, the indicator overlays three distinct lines right over your asset's price chart. These lines form a dynamic envelope around price action, expanding automatically when things get wild and squeezing tight when the market goes quiet.
Because the math behind the outer lines uses standard deviation, roughly 95% of all price action ends up staying within the upper and lower boundaries. Whenever price pushes through or taps those outer edges, it's a heads-up that something unusual is happening in the market, often pointing to potential trade setups.
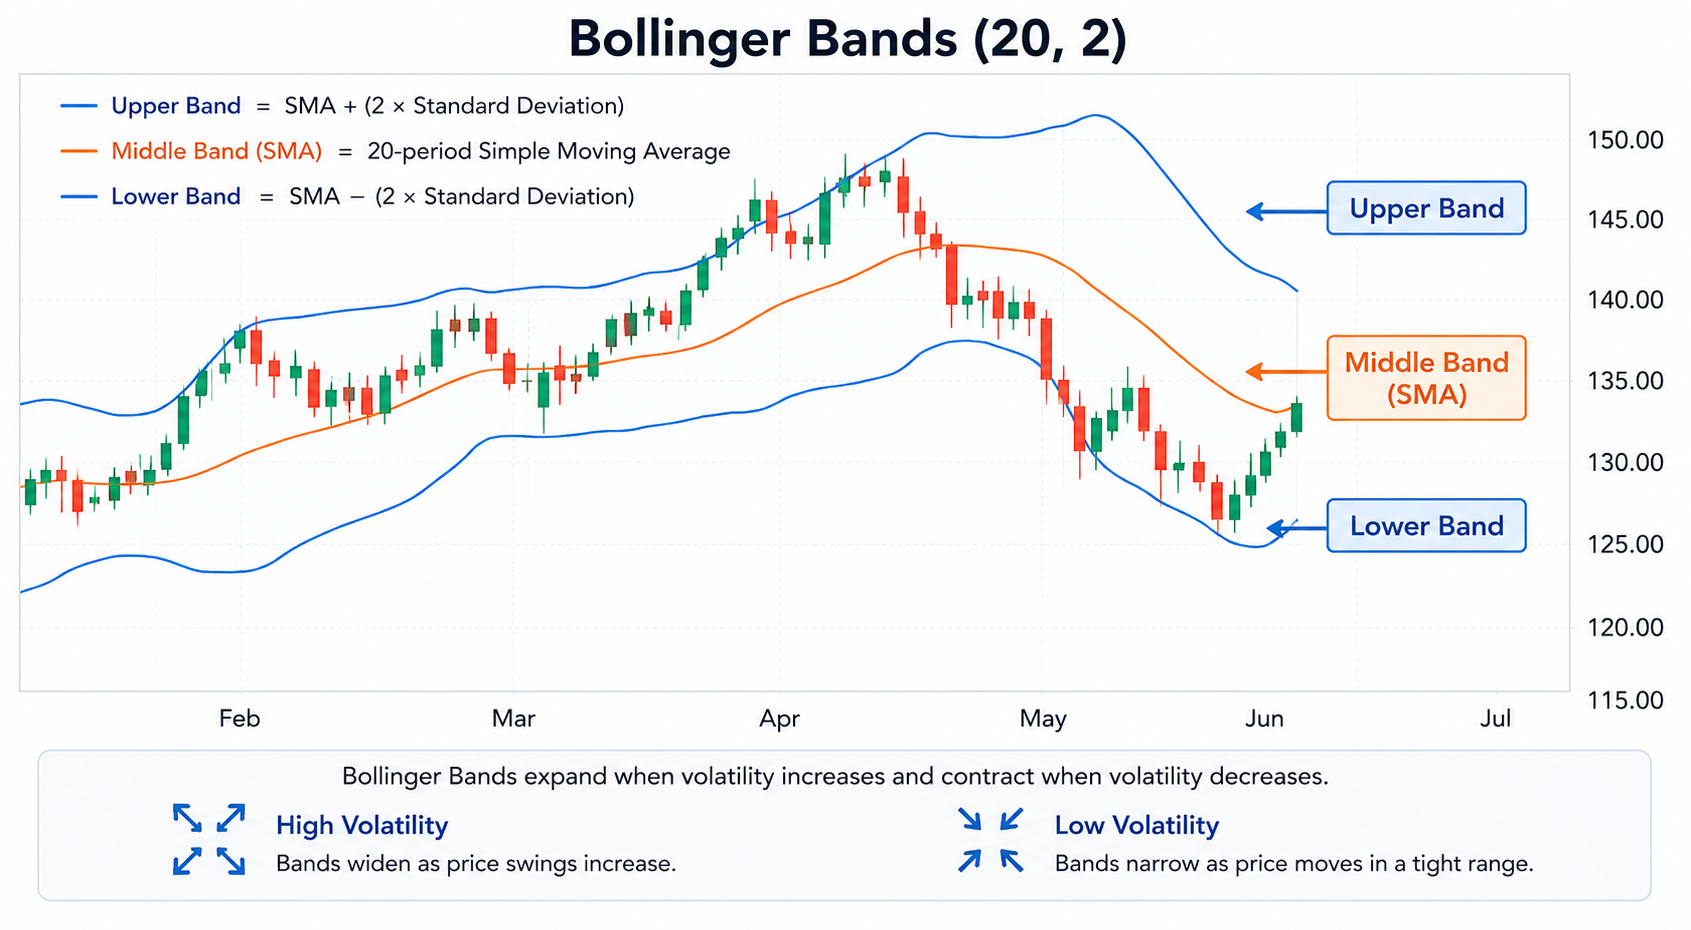
To make sense of what you see on the chart, you need to know what each line is doing:
Your charting software handles all the math automatically, but walking through the calculation helps you figure out how to tweak the settings for different timeframes or market environments.
The middle line relies on the classic moving average calculation:
Middle Band = SMA(P, n)
Here, $P$ represents closing prices across your chosen lookback period $n$. From there, the outer boundaries expand or contract around that average using standard deviation:
Upper Band = Middle Band + (K x sigma)
Lower Ban} = Middle Band - (K x sigma)
In these equations, K is your multiplier (usually set to 2), while sigma is the standard deviation of closing prices over n periods.
| Component | Standard Setting | Formula / Logic |
| Lookback Period ($n$) | 20 periods | The number of price bars evaluated |
| Middle Band | 20-period SMA | Total of the last 20 closes divided by 20 |
| Multiplier ($K$) | 2.0 | How far the outer bands sit from the middle line |
| Coverage Area | ~95% of price data | Expected statistical coverage during normal conditions |
Standard deviation basically measures how far prices are straying from their average. When price swings get large and unpredictable, standard deviation jumps, blowing the upper and lower bands wide open. When prices drift sideways in a tight range, standard deviation drops, pulling the outer bands close to the middle line.
This constant auto-adjusting is what makes the indicator so useful. Instead of forcing you to rely on rigid, fixed support and resistance lines, it gives you dynamic levels that shift as market volume and sentiment change.
John Bollinger pointed out several reliable chart patterns that happen over and over when price interacts with the bands. Learning to recognize these structures helps you stay one step ahead of major moves.
A Squeeze happens when volatility drops to unusually low levels, forcing the bands to pinch tightly together around the price bars. Since quiet markets almost always lead to big explosive moves, a tight squeeze acts like a coiled spring, warning you that a significant breakout is coming soon.
Traders wait for price to break out clearly above the top band or below the bottom band following a squeeze. That said, keep an eye out for fakeouts; it's pretty common for price to poke out one side briefly just to trap traders before ripping in the opposite direction.
The W-Bottom is a classic reversal setup that forms near the end of a downtrend. It plays out in four main steps:
Even if the second price drop reaches the exact same level as the first one, the fact that it stayed inside the lower band shows that selling pressure is wearing off.
An M-Top is simply the bearish version of the W-Bottom, forming at market peaks:
This clear loss of momentum shows that buyers are running out of steam, making a downward turn much more likely.
Looking at patterns on a chart is helpful, but having concrete rules turns those visual cues into an actionable trading process.
This system is built around catching a fresh, powerful trend right at the start. You start by looking for a prolonged Squeeze where the bands have squeezed down into a tight range.
Once a candle closes firmly outside one of the outer bands on solid volume, you take the trade in the direction of that move. Put your stop loss on the opposite side of the 20-period moving average. You stay in the trade as long as price hugs that outer band, exiting once price pulls back and crosses through the middle line.
Mean reversion approaches work best in choppy, sideways markets rather than strong trending environments. The basic idea is simple: when price strays too far from its 20-period average, it eventually gets pulled back toward the center line.
You look for price to touch or extend past an outer band while an indicator like the RSI shows overbought or oversold conditions. Once you get a clear reversal candle confirming the turn, you trade back toward the middle line as your main profit target, placing a tight stop just beyond the recent swing point.
A common trap for new traders is assuming that every touch of an upper band means it's time to sell. During aggressive bull trends, price will often "walk the band" for days or weeks, continuously pressing against the top line as buying stays intense.
With this strategy, hitting the upper band isn't treated as a sell signal; it's treated as confirmation that the trend is strong. As long as price closes between the upper line and the middle SMA, the trend remains intact, and quick pull-backs toward that middle average give you sensible re-entry opportunities.
Even experienced traders run into trouble with Bollinger Bands when they try to oversimplify how the indicator works. Sidestep these frequent mistakes to keep your account safe:
To make your analysis far more accurate, pair Bollinger Bands with indicators that measure underlying momentum or trading volume.
Combining the bands with the Relative Strength Index (RSI) works remarkably well for identifying trend weakness. For instance, if price makes a new high and touches the upper band, but the RSI makes a lower high, you're looking at a momentum divergence. That setup gives you a much stronger signal than relying on either tool by itself.
Volume indicators like On-Balance Volume (OBV) or basic volume bars also help verify whether a breakout is real. A breakout coming out of a Squeeze on heavy volume is far more reliable than a slow drift past the band on weak participation. Combining these tools thoughtfully gives you a grounded, reliable framework for navigating the market.
Can you use Bollinger Bands on 1-minute or 5-minute day trading charts?
Yes, Bollinger Bands work across all timeframes, including intraday charts. However, lower timeframes generate significantly more false signals due to market noise. Day traders often increase the moving average period slightly or pair the bands with strict volume confirmation to filter out bad entries.
What is the difference between Keltner Channels and Bollinger Bands?
While both indicators create price channels around a moving average, Bollinger Bands use standard deviation to set band width based on volatility. Keltner Channels use Average True Range (ATR) instead. This makes Keltner Channels smoother and less prone to sudden expansions compared to Bollinger Bands.
Who is John Bollinger, and are Bollinger Bands patented?
John Bollinger is an American financial analyst and Chartered Financial Analyst (CFA) who introduced the bands in his 2001 book Bollinger on Bollinger Bands. The term "Bollinger Bands" is a registered trademark owned by him, though the mathematical formula remains open for public use across all trading software.
How do you adjust Bollinger Bands for cryptocurrency trading?
Crypto markets trade 24/7 with much higher baseline volatility than traditional equities. Many crypto traders adjust the standard setting from a 2.0 multiplier to 2.2 or 2.5 to account for extreme price spikes, reducing the number of false breakout signals on daily and 4-hour charts.
What is %b in relation to Bollinger Bands?
%b is a secondary indicator derived from Bollinger Bands that quantifies where price is relative to the bands as a single decimal or percentage. A value of 1.0 means price is at the upper band, 0.5 means it sits on the middle SMA, and 0.0 means it rests on the lower band. It helps traders easily code quantitative trading algorithms.
Would like to learn how to look financial markets from a different angle? Then keep reading and invest yourself with ZitaPlus.